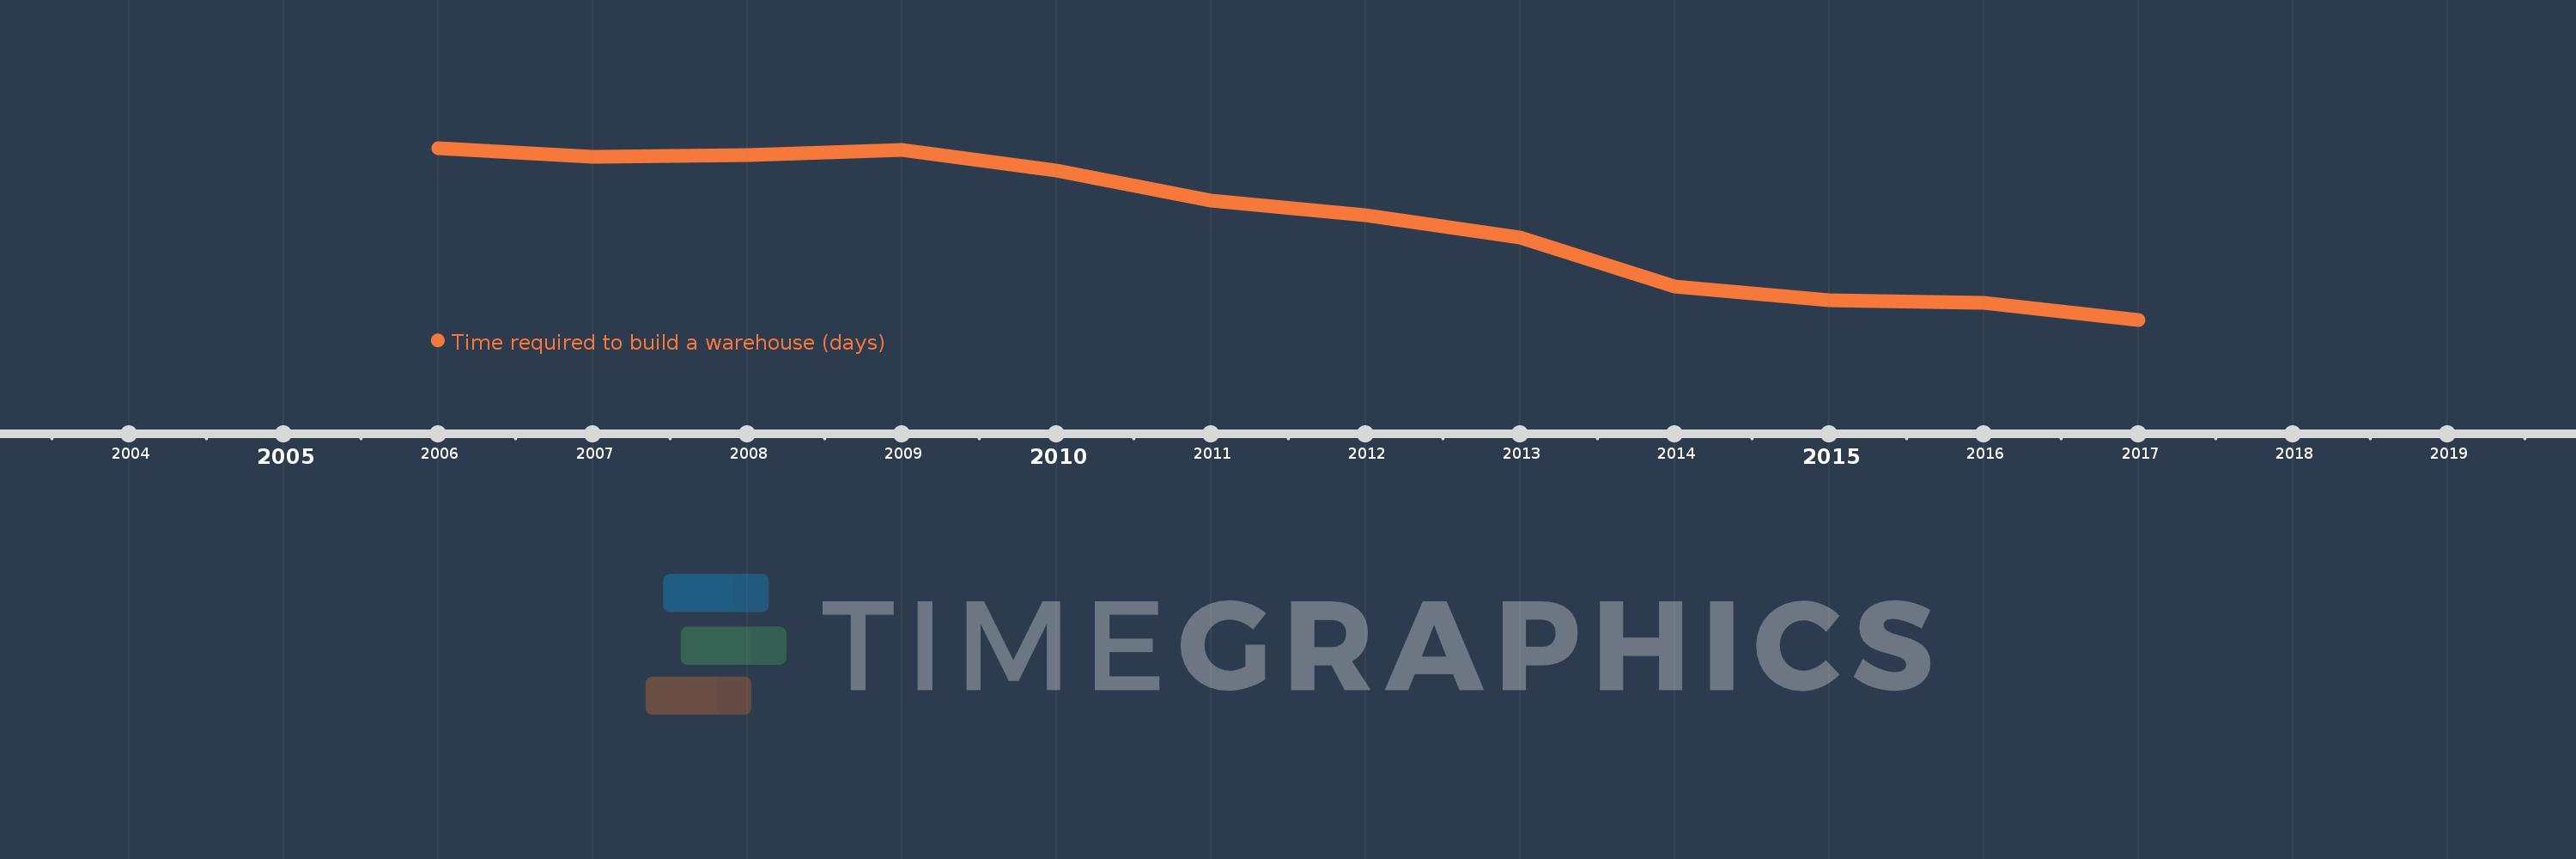
This timeline shows a graph from 2006 to 2017 of Sub-Saharan Africa (excluding high income). No data until 2005. Number of actual observations by date: 12.
Source name:
World Development Indicators
Source organization:
World Bank, Doing Business project (http://www.doingbusiness.org/).
Categories, topics:
Private Sector
Last updated:
apr 23, 2017
Indicators value changes by year
Meaning:
188.54
Minimum:
155.74
jan 1, 2017
Maximum:
212.395
jan 1, 2006
At the date of observation
Value
Absolute change
Change from the previous value
jan 1, 2006
212.395
+212.395
0.0%
jan 1, 2007
209.568
-2.827
-1.33%
jan 1, 2008
209.977
+0.409
0.2%
jan 1, 2009
211.75
+1.773
0.84%
jan 1, 2010
204.841
-6.909
-3.26%
jan 1, 2011
195.023
-9.818
-4.79%
jan 1, 2012
190.295
-4.727
-2.42%
jan 1, 2013
182.778
-7.518
-3.95%
jan 1, 2014
166.562
-16.216
-8.87%
jan 1, 2015
162.273
-4.289
-2.57%
jan 1, 2016
161.273
-1.0
-0.62%
jan 1, 2017
155.74
-5.533
-3.43%
Ranking of countries by current statistics by years