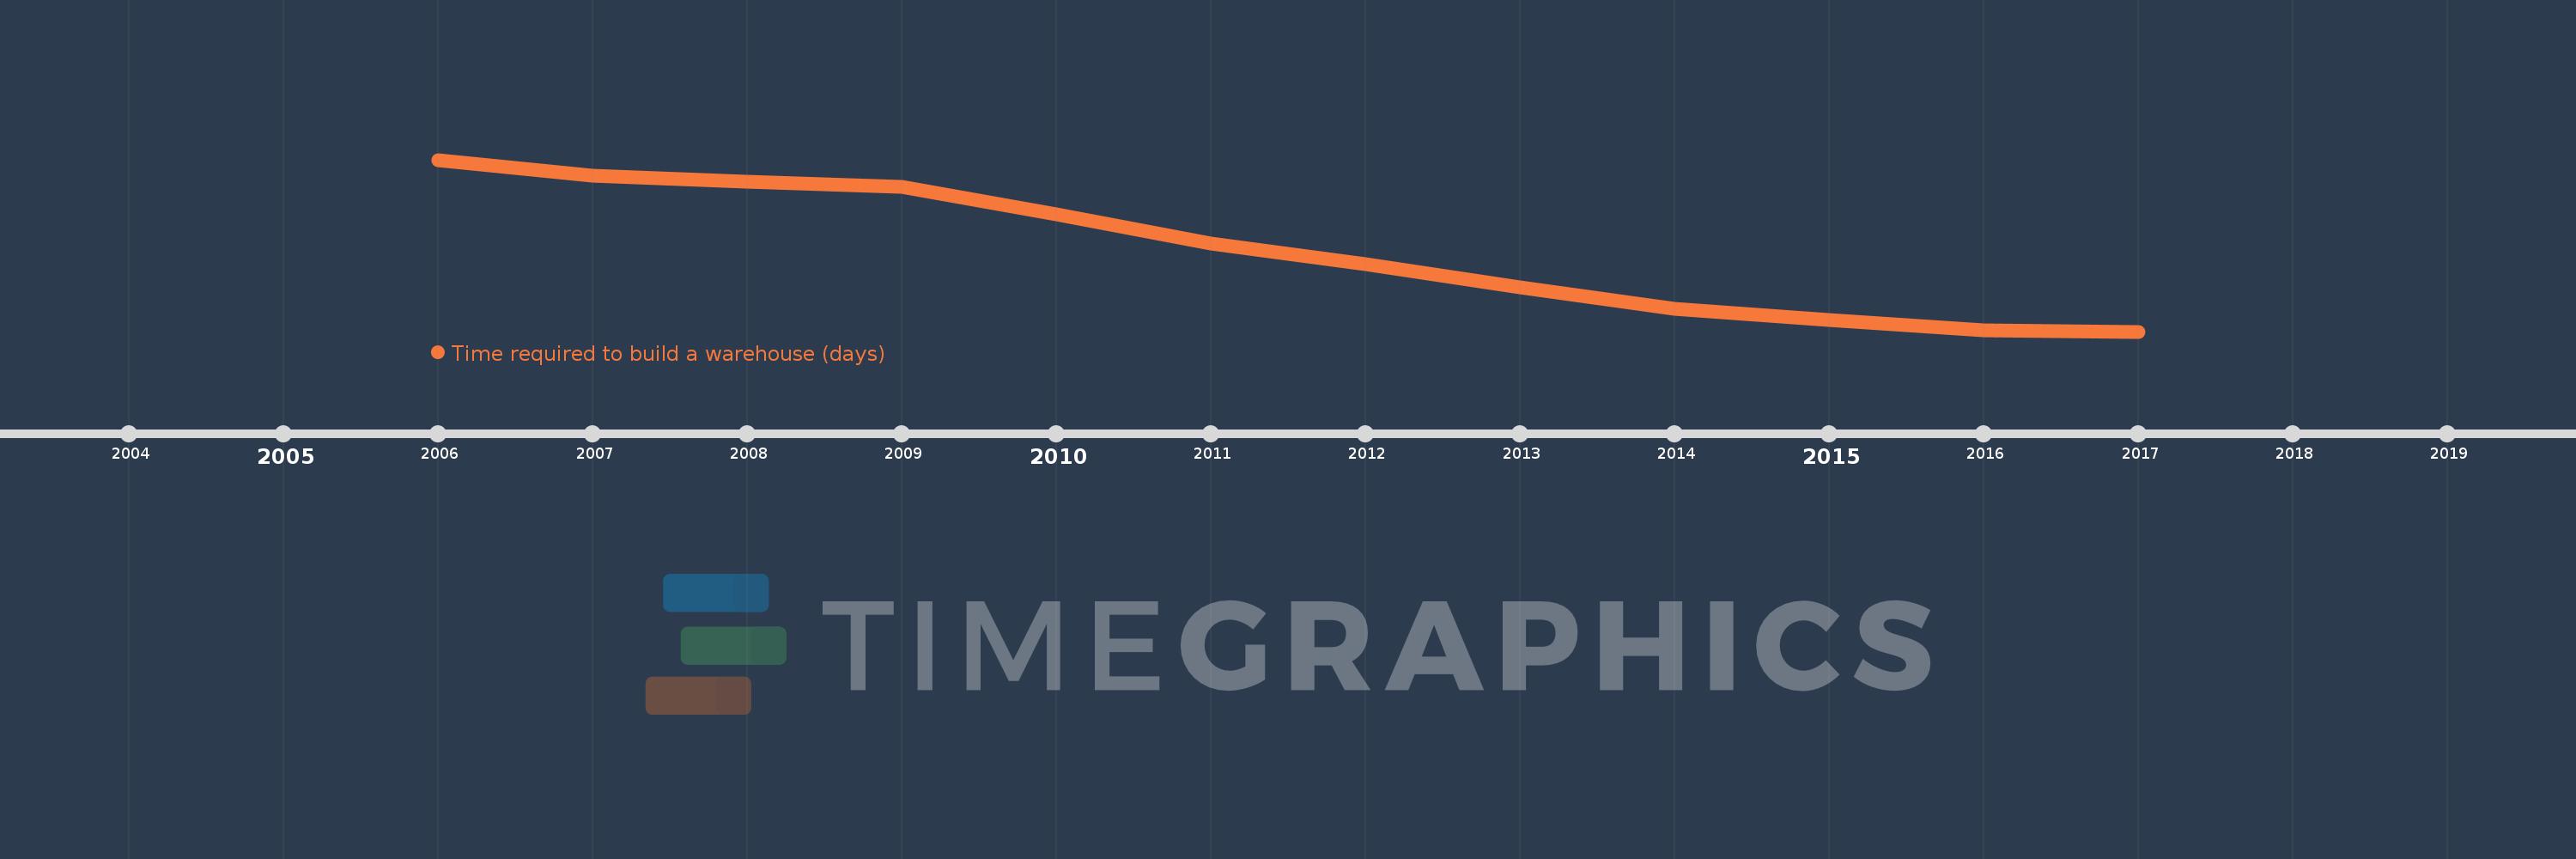
This timeline shows a graph from 2006 to 2017 of Least developed countries: UN classification. No data until 2005. Number of actual observations by date: 12.
Source name:
World Development Indicators
Source organization:
World Bank, Doing Business project (http://www.doingbusiness.org/).
Categories, topics:
Private Sector
Last updated:
apr 23, 2017
Indicators value changes by year
Meaning:
182.934
Minimum:
158.978
jan 1, 2017
Maximum:
209.571
jan 1, 2006
At the date of observation
Value
Absolute change
Change from the previous value
jan 1, 2006
209.571
+209.571
0.0%
jan 1, 2007
204.884
-4.688
-2.24%
jan 1, 2008
203.14
-1.744
-0.85%
jan 1, 2009
201.605
-1.535
-0.76%
jan 1, 2010
193.395
-8.209
-4.07%
jan 1, 2011
185.023
-8.372
-4.33%
jan 1, 2012
178.884
-6.14
-3.32%
jan 1, 2013
172.089
-6.795
-3.8%
jan 1, 2014
165.756
-6.333
-3.68%
jan 1, 2015
162.422
-3.333
-2.01%
jan 1, 2016
159.467
-2.956
-1.82%
jan 1, 2017
158.978
-0.489
-0.31%
Ranking of countries by current statistics by years