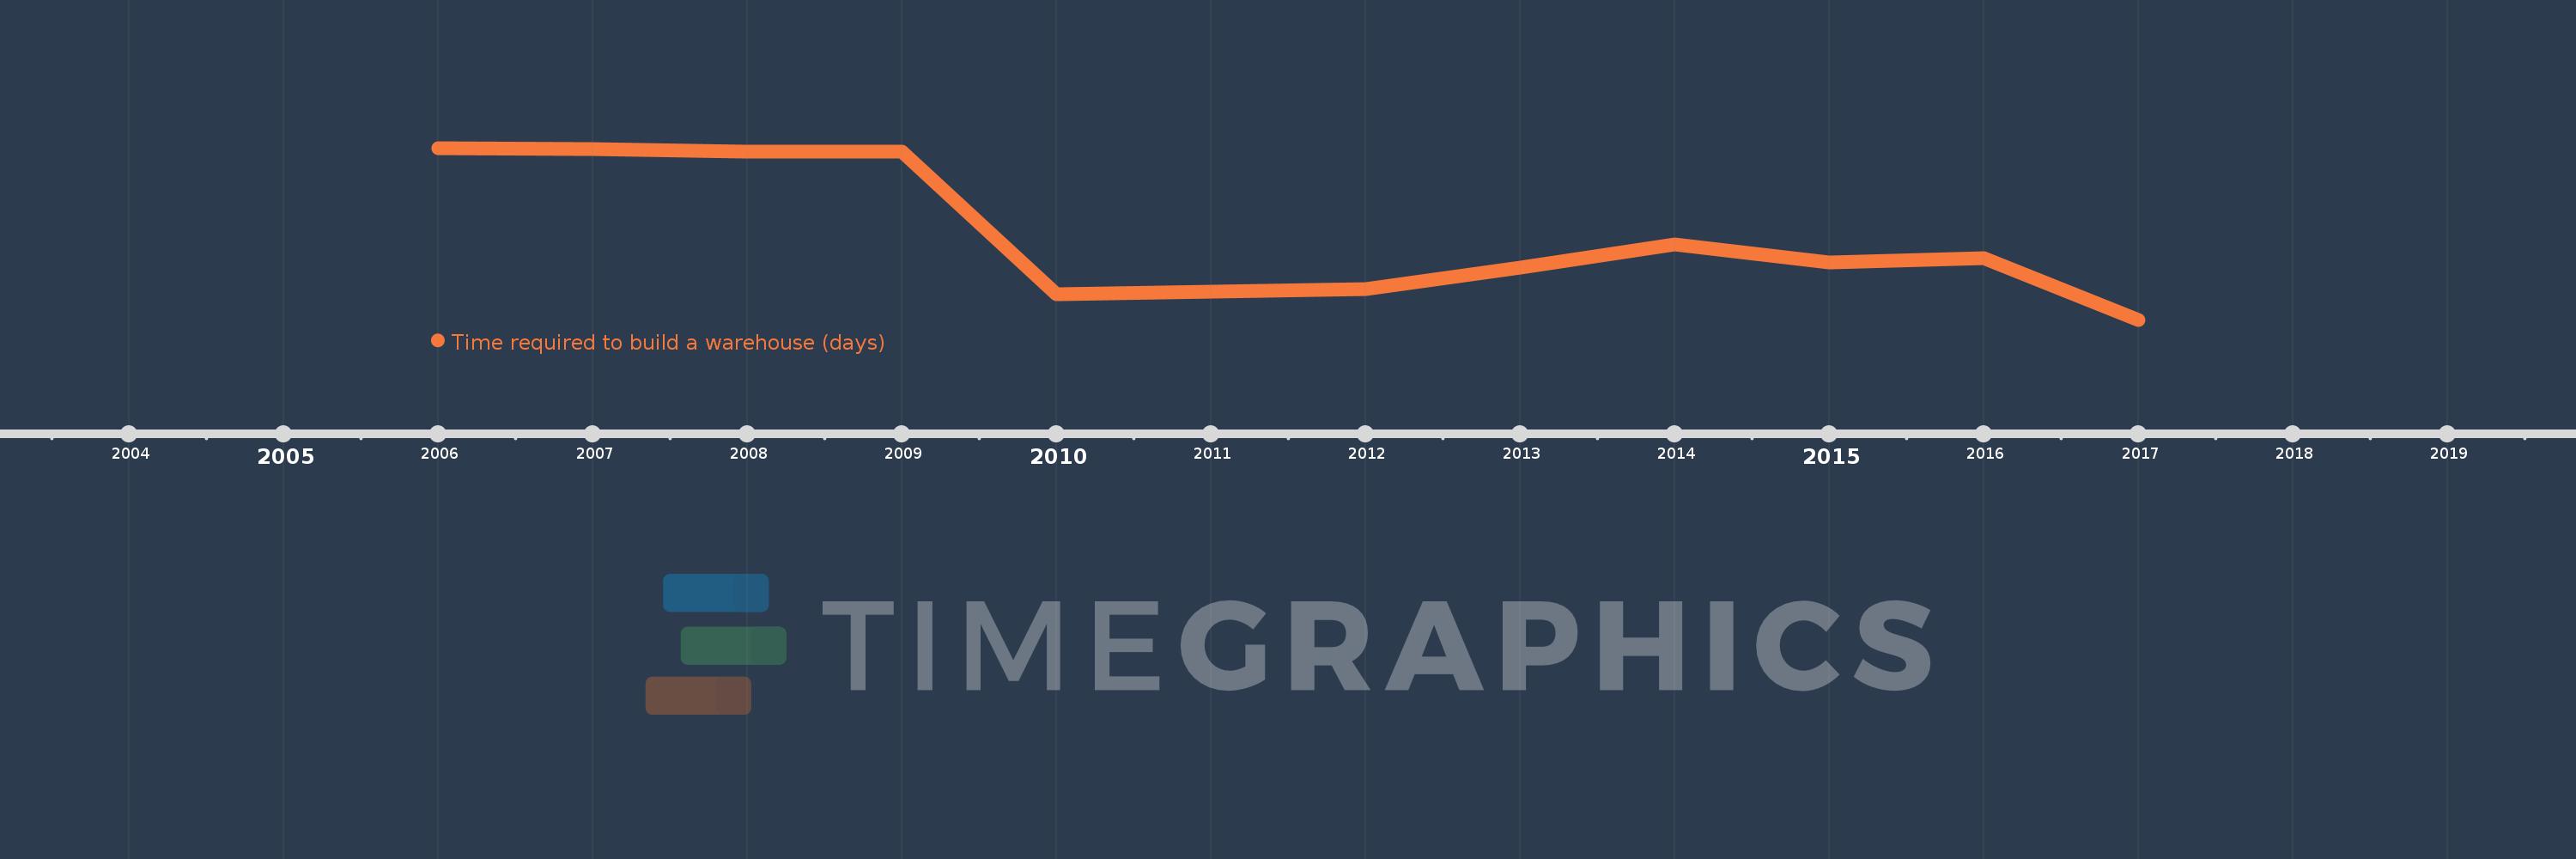
This timeline shows a graph from 2006 to 2017 of Middle East & North Africa (excluding high income). No data until 2005. Number of actual observations by date: 12.
Source name:
World Development Indicators
Source organization:
World Bank, Doing Business project (http://www.doingbusiness.org/).
Categories, topics:
Private Sector
Last updated:
apr 23, 2017
Indicators value changes by year
Meaning:
149.442
Minimum:
130.227
jan 1, 2017
Maximum:
169.5
jan 1, 2006
At the date of observation
Value
Absolute change
Change from the previous value
jan 1, 2006
169.5
+169.5
0.0%
jan 1, 2007
169.333
-0.167
-0.1%
jan 1, 2008
168.667
-0.667
-0.39%
jan 1, 2009
168.667
0.0
0.0%
jan 1, 2010
136.083
-32.583
-19.32%
jan 1, 2011
136.667
+0.583
0.43%
jan 1, 2012
137.167
+0.5
0.37%
jan 1, 2013
142.083
+4.917
3.58%
jan 1, 2014
147.364
+5.28
3.72%
jan 1, 2015
143.273
-4.091
-2.78%
jan 1, 2016
144.273
+1.0
0.7%
jan 1, 2017
130.227
-14.045
-9.74%
Ranking of countries by current statistics by years