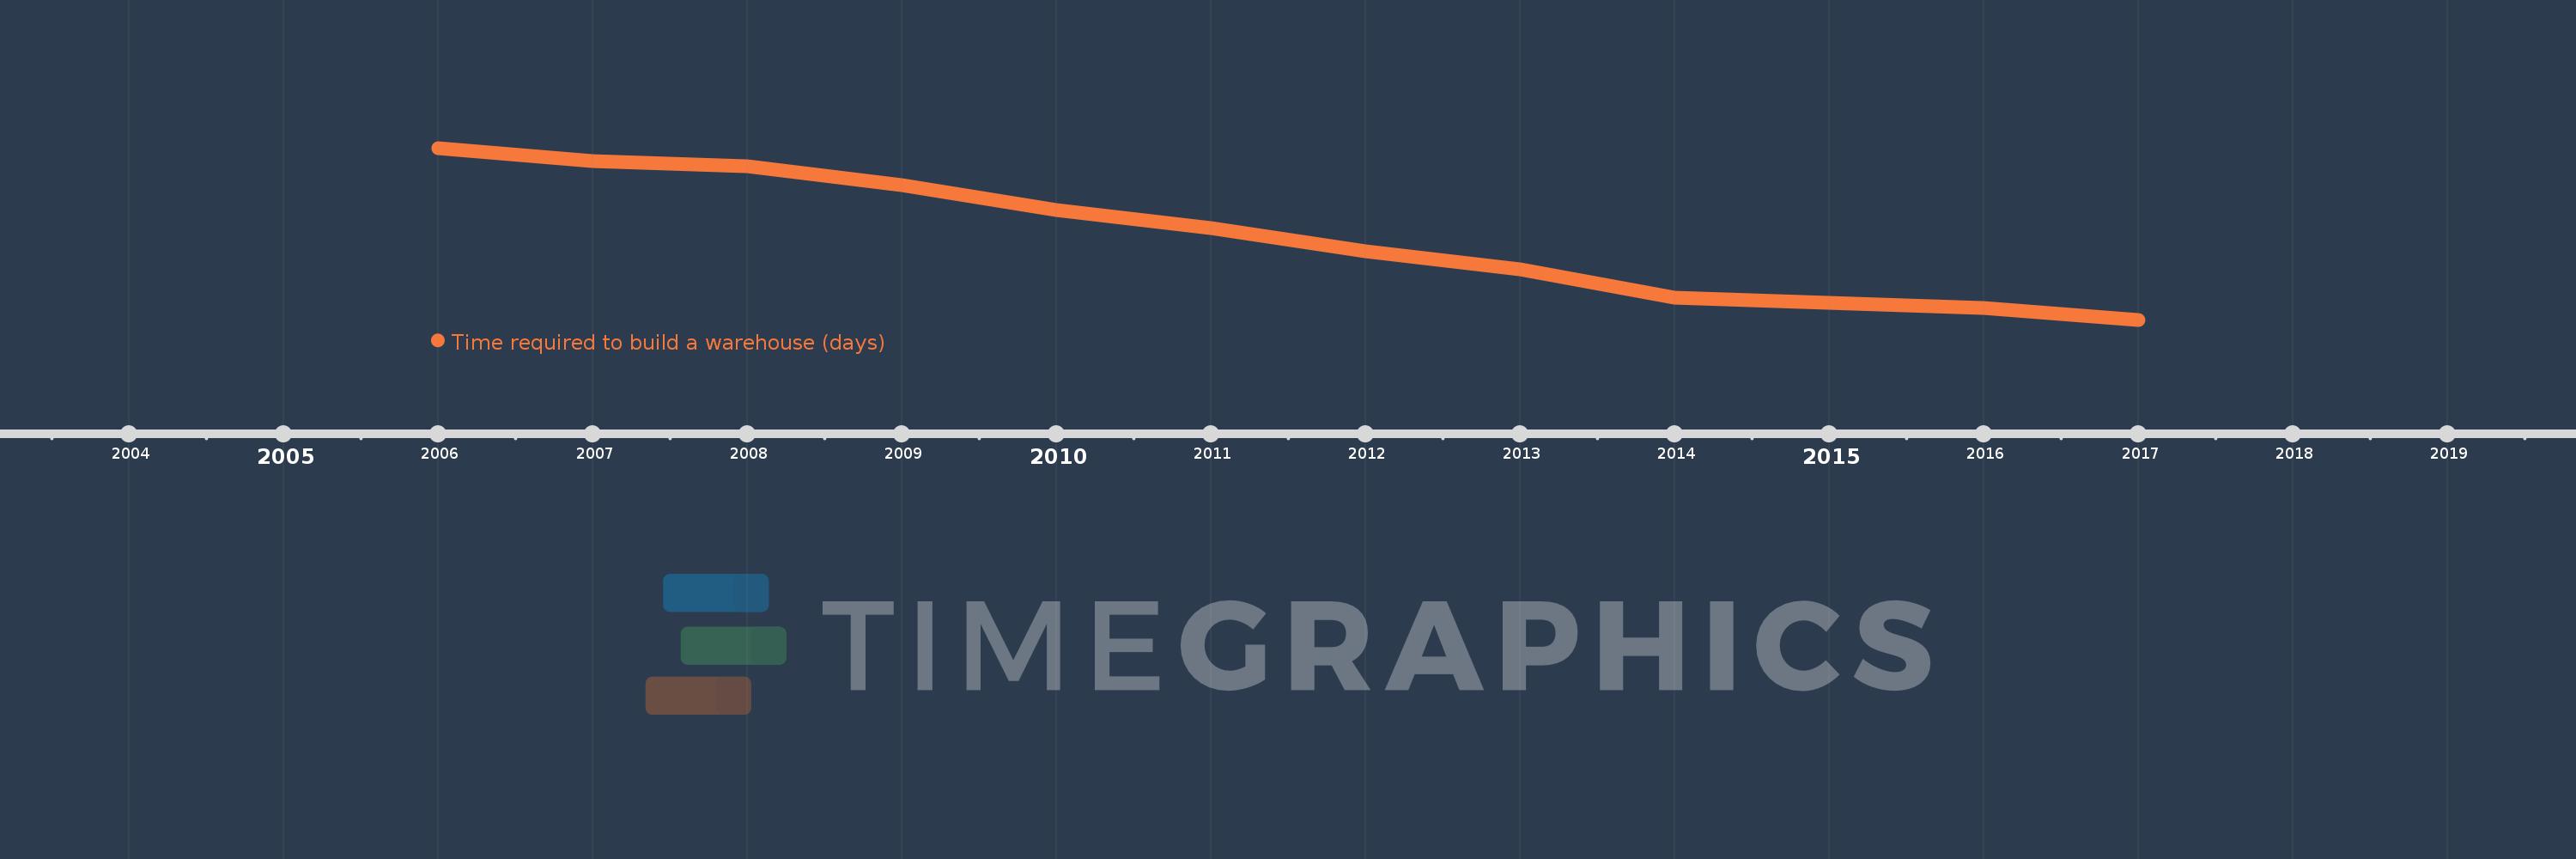
This timeline shows a graph from 2006 to 2017 of Europe & Central Asia (excluding high income). No data until 2005. Number of actual observations by date: 12.
Source name:
World Development Indicators
Source organization:
World Bank, Doing Business project (http://www.doingbusiness.org/).
Categories, topics:
Private Sector
Last updated:
apr 23, 2017
Indicators value changes by year
Meaning:
217.985
Minimum:
149.365
jan 1, 2017
Maximum:
292.361
jan 1, 2006
At the date of observation
Value
Absolute change
Change from the previous value
jan 1, 2006
292.361
+292.361
0.0%
jan 1, 2007
281.132
-11.23
-3.84%
jan 1, 2008
277.079
-4.053
-1.44%
jan 1, 2009
261.342
-15.737
-5.68%
jan 1, 2010
240.425
-20.917
-8.0%
jan 1, 2011
225.575
-14.85
-6.18%
jan 1, 2012
206.053
-19.522
-8.65%
jan 1, 2013
191.579
-14.474
-7.02%
jan 1, 2014
167.921
-23.658
-12.35%
jan 1, 2015
163.725
-4.196
-2.5%
jan 1, 2016
159.268
-4.457
-2.72%
jan 1, 2017
149.365
-9.903
-6.22%
Ranking of countries by current statistics by years