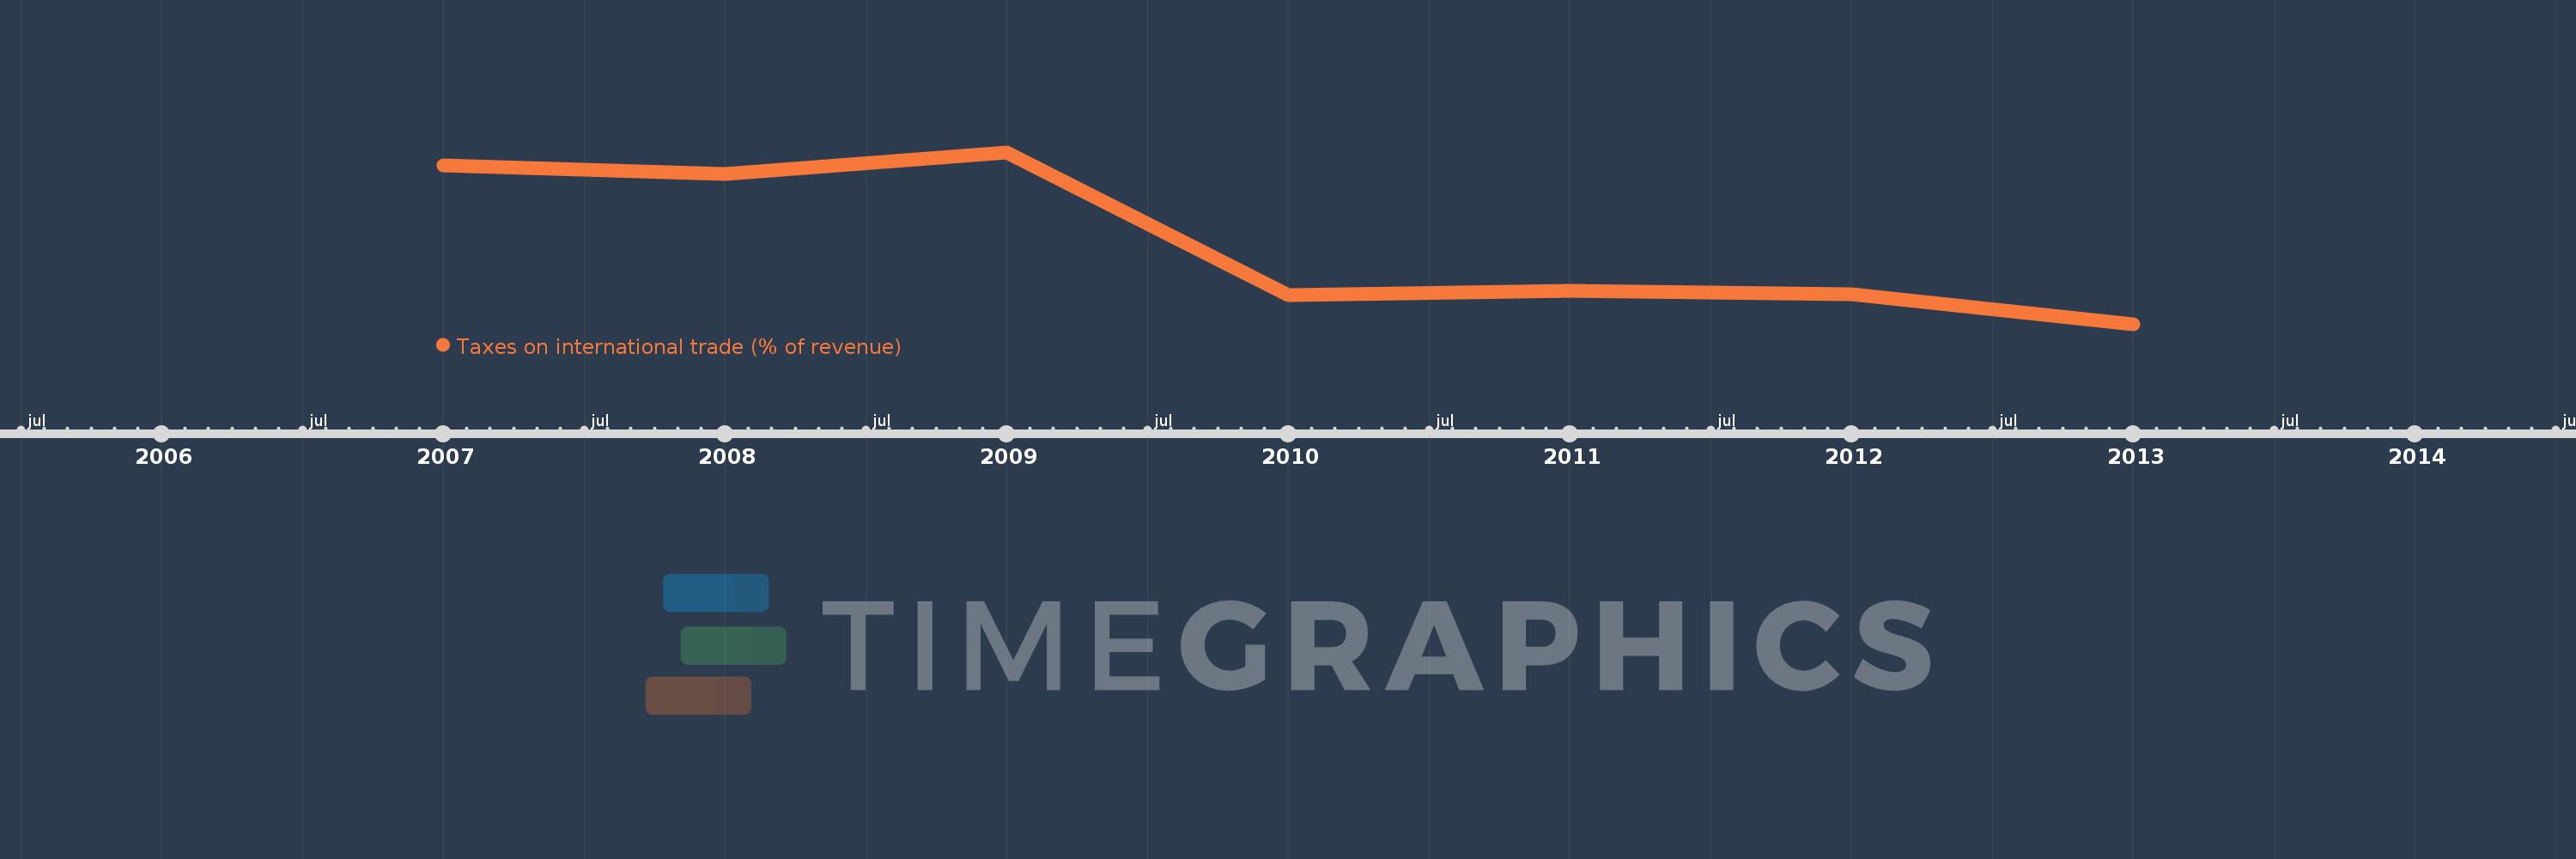
This timeline shows a graph from 2007 to 2013 of Sub-Saharan Africa (excluding high income). No data until 2006. Number of actual observations by date: 7.
Source name:
World Development Indicators
Source organization:
International Monetary Fund, Government Finance Statistics Yearbook and data files.
Categories, topics:
Public Sector
Last updated:
apr 23, 2017
Indicators value changes by year
Meaning:
15.347
Minimum:
11.644
jan 1, 2013
Maximum:
19.4
jan 1, 2009
At the date of observation
Value
Absolute change
Change from the previous value
jan 1, 2007
18.809
+18.809
0.0%
jan 1, 2008
18.433
-0.376
-2.0%
jan 1, 2009
19.4
+0.967
5.25%
jan 1, 2010
12.962
-6.438
-33.18%
jan 1, 2011
13.17
+0.207
1.6%
jan 1, 2012
13.01
-0.16
-1.21%
jan 1, 2013
11.644
-1.366
-10.5%
Ranking of countries by current statistics by years