33
/
AIzaSyB4mHJ5NPEv-XzF7P6NDYXjlkCWaeKw5bc
November 1, 2025
156789
Indonesia
IDN
true
2
1
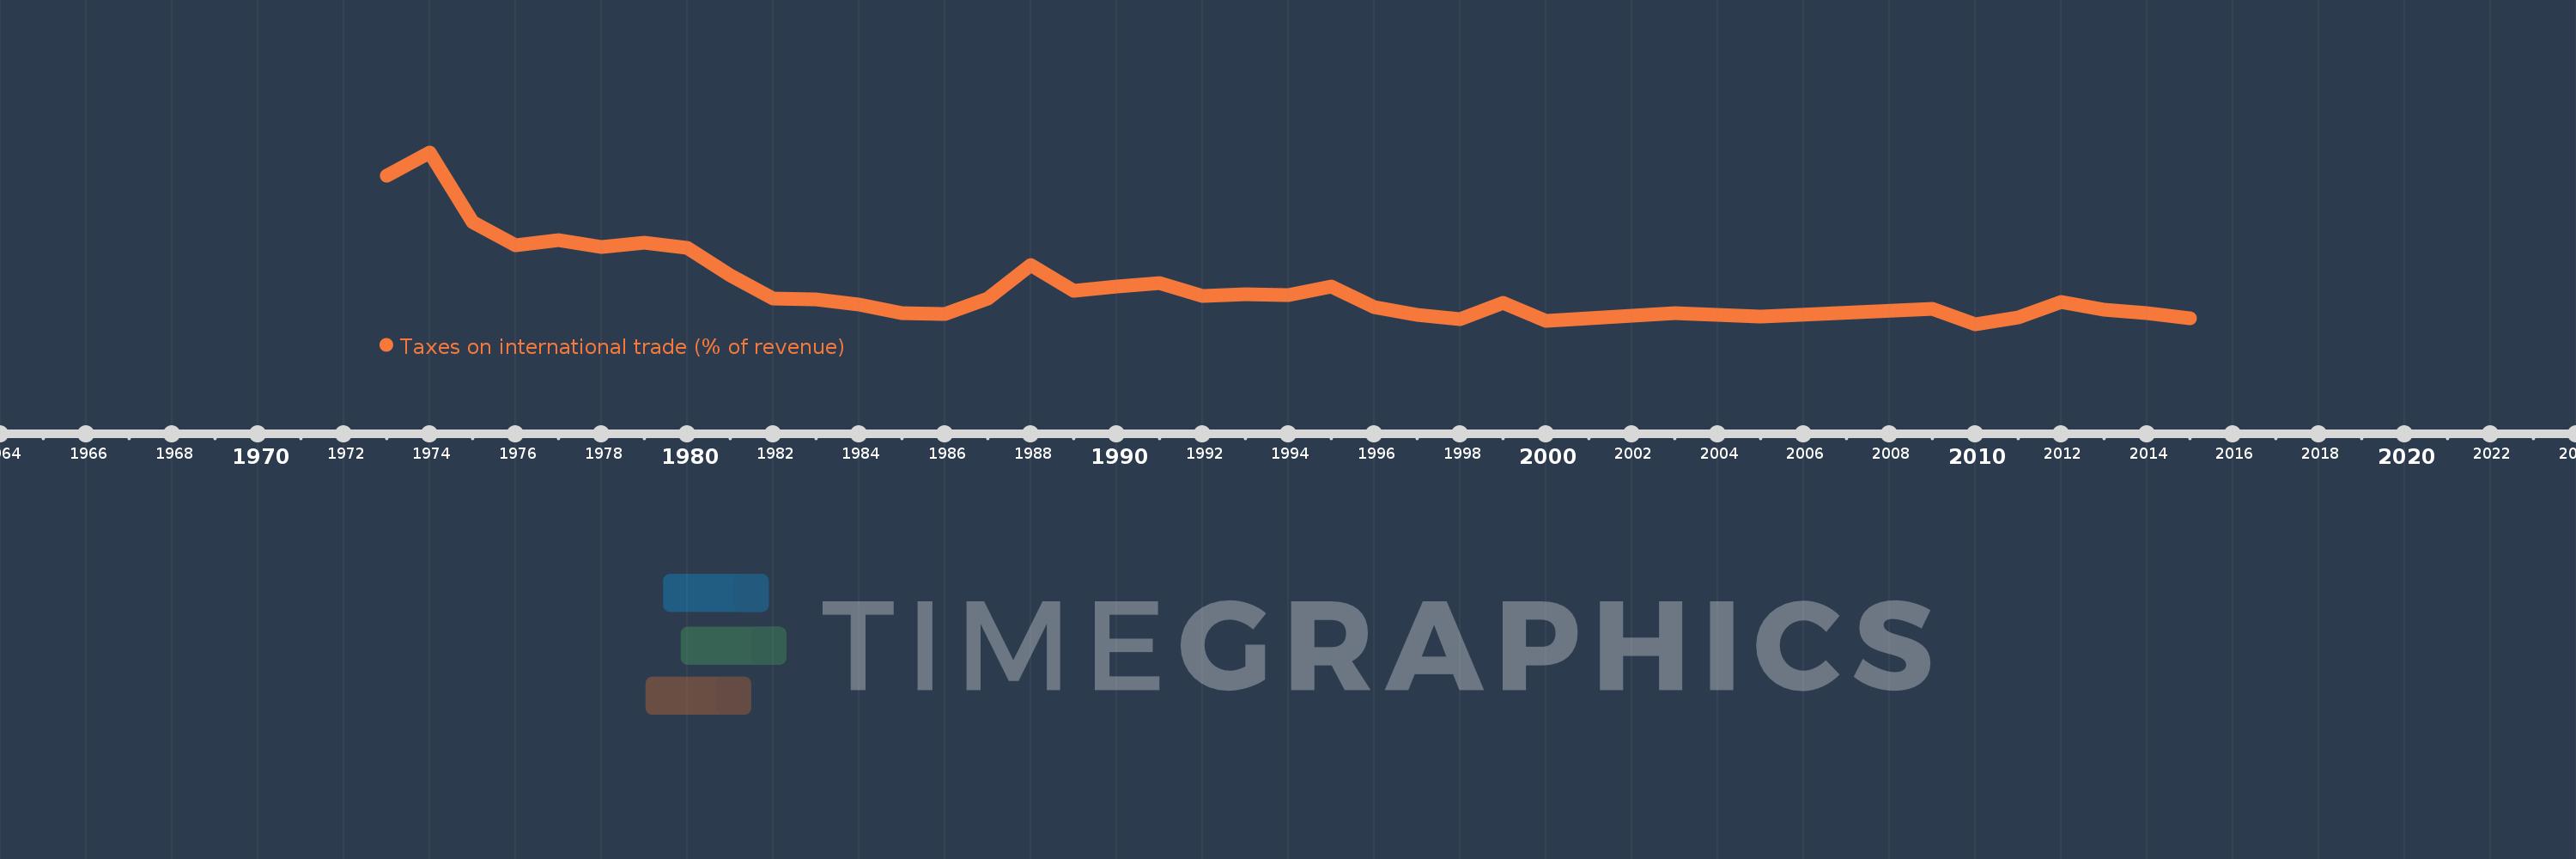
Taxes on international trade (% of revenue)
2015,2014,2013,2012,2011,2010,2009,2005,2004,2003,2002,2000,1999,1998,1997,1996,1995,1994,1993,1992,1991,1990,1989,1988,1987,1986,1985,1984,1983,1982,1981,1980,1979,1978,1977,1976,1975,1974,1973