33
/
AIzaSyB4mHJ5NPEv-XzF7P6NDYXjlkCWaeKw5bc
November 30, 2025
142386
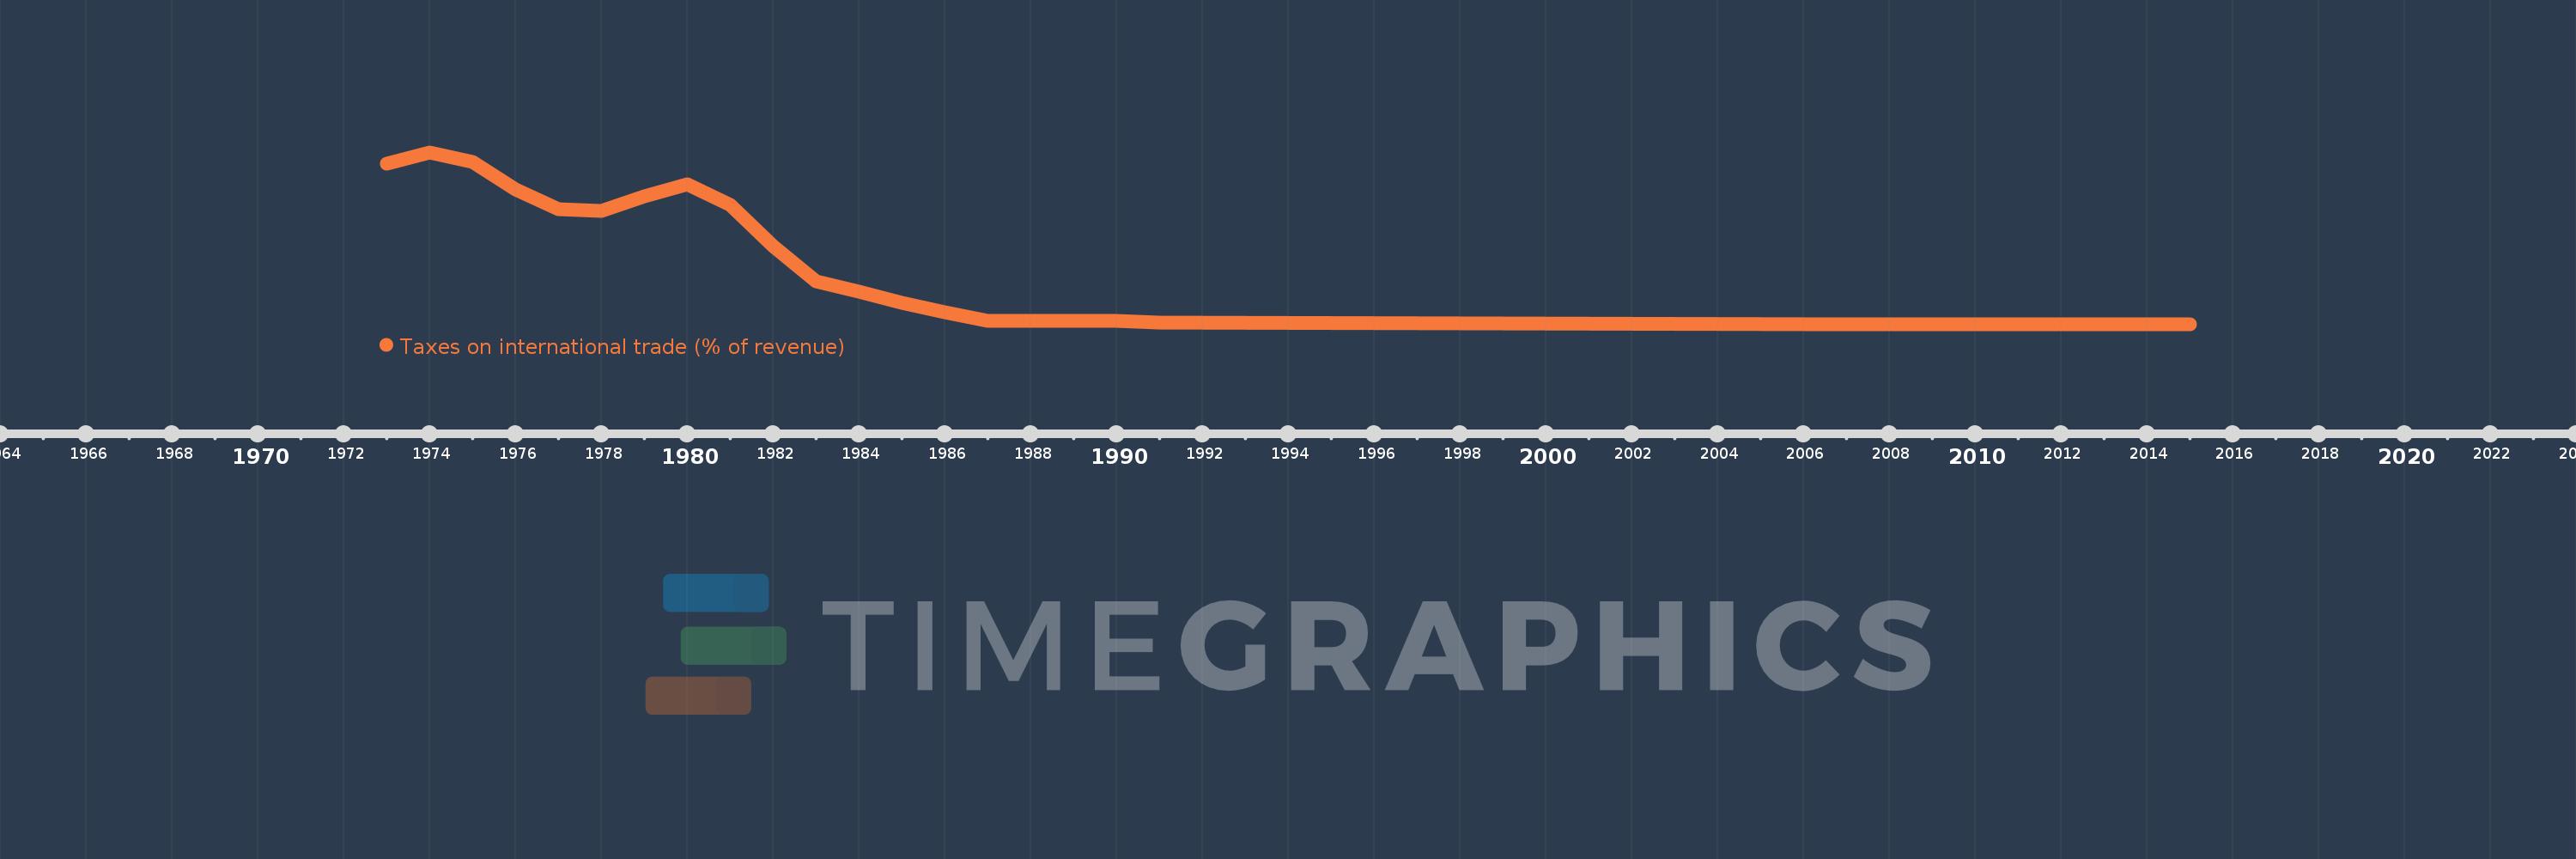
Greece
GRC
true
2
1
Taxes on international trade (% of revenue)
2015,2014,2012,2011,2010,2009,2008,2007,1991,1990,1989,1988,1987,1986,1985,1984,1983,1982,1981,1980,1979,1978,1977,1976,1975,1974,1973