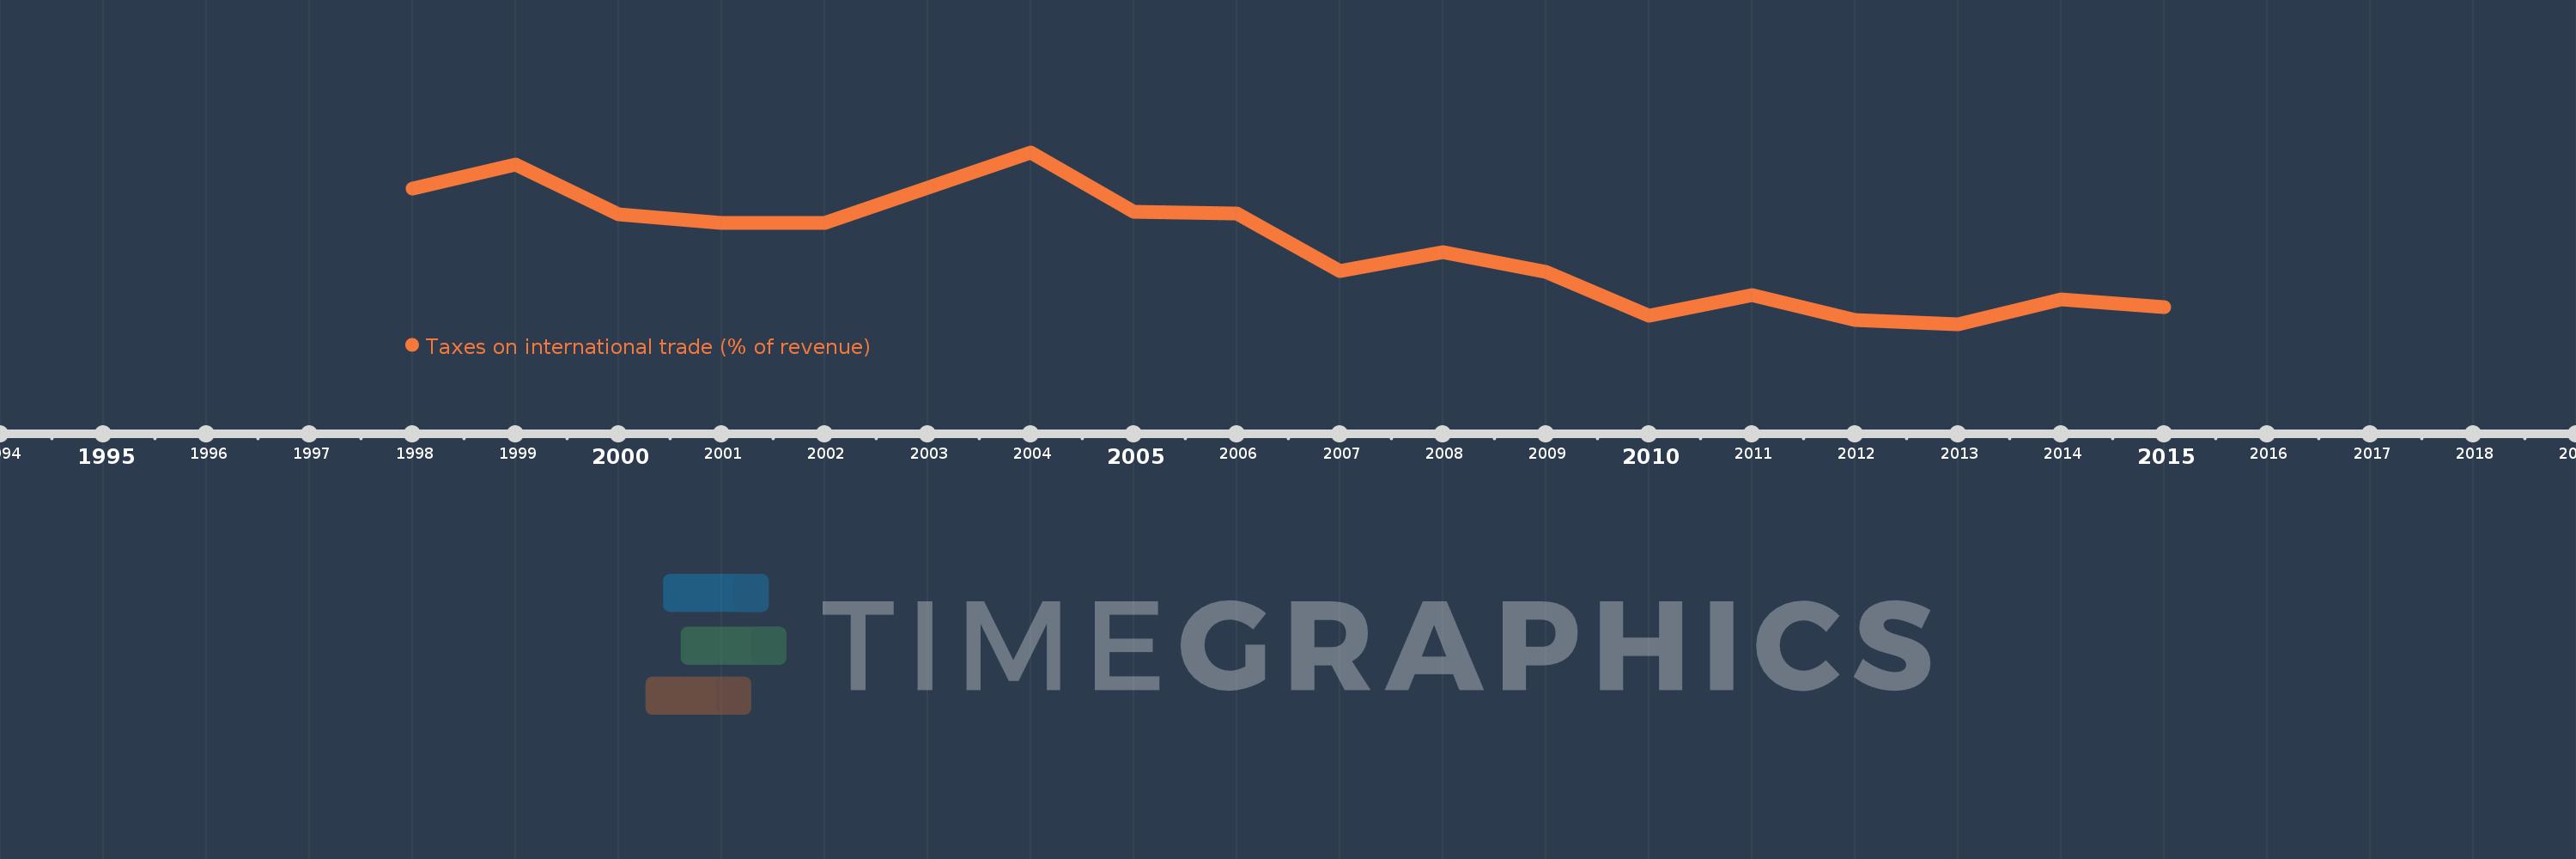
This timeline shows a graph from 1998 to 2015 of Europe & Central Asia (excluding high income). No data until 1997. Number of actual observations by date: 17.
Source name:
World Development Indicators
Source organization:
International Monetary Fund, Government Finance Statistics Yearbook and data files.
Categories, topics:
Public Sector
Last updated:
apr 23, 2017
Indicators value changes by year
Meaning:
4.612
Minimum:
2.955
jan 1, 2013
Maximum:
6.782
jan 1, 2004
At the date of observation
Value
Absolute change
Change from the previous value
jan 1, 1998
5.985
+5.985
0.0%
jan 1, 1999
6.517
+0.531
8.88%
jan 1, 2000
5.403
-1.114
-17.1%
jan 1, 2001
5.208
-0.194
-3.6%
jan 1, 2002
5.208
+0.0
0.0%
jan 1, 2004
6.782
+1.574
30.22%
jan 1, 2005
5.455
-1.327
-19.56%
jan 1, 2006
5.418
-0.037
-0.68%
jan 1, 2007
4.149
-1.269
-23.42%
jan 1, 2008
4.562
+0.412
9.94%
jan 1, 2009
4.113
-0.448
-9.82%
jan 1, 2010
3.136
-0.978
-23.77%
jan 1, 2011
3.603
+0.467
14.9%
jan 1, 2012
3.05
-0.553
-15.36%
jan 1, 2013
2.955
-0.094
-3.09%
jan 1, 2014
3.51
+0.554
18.76%
jan 1, 2015
3.344
-0.166
-4.73%
Ranking of countries by current statistics by years