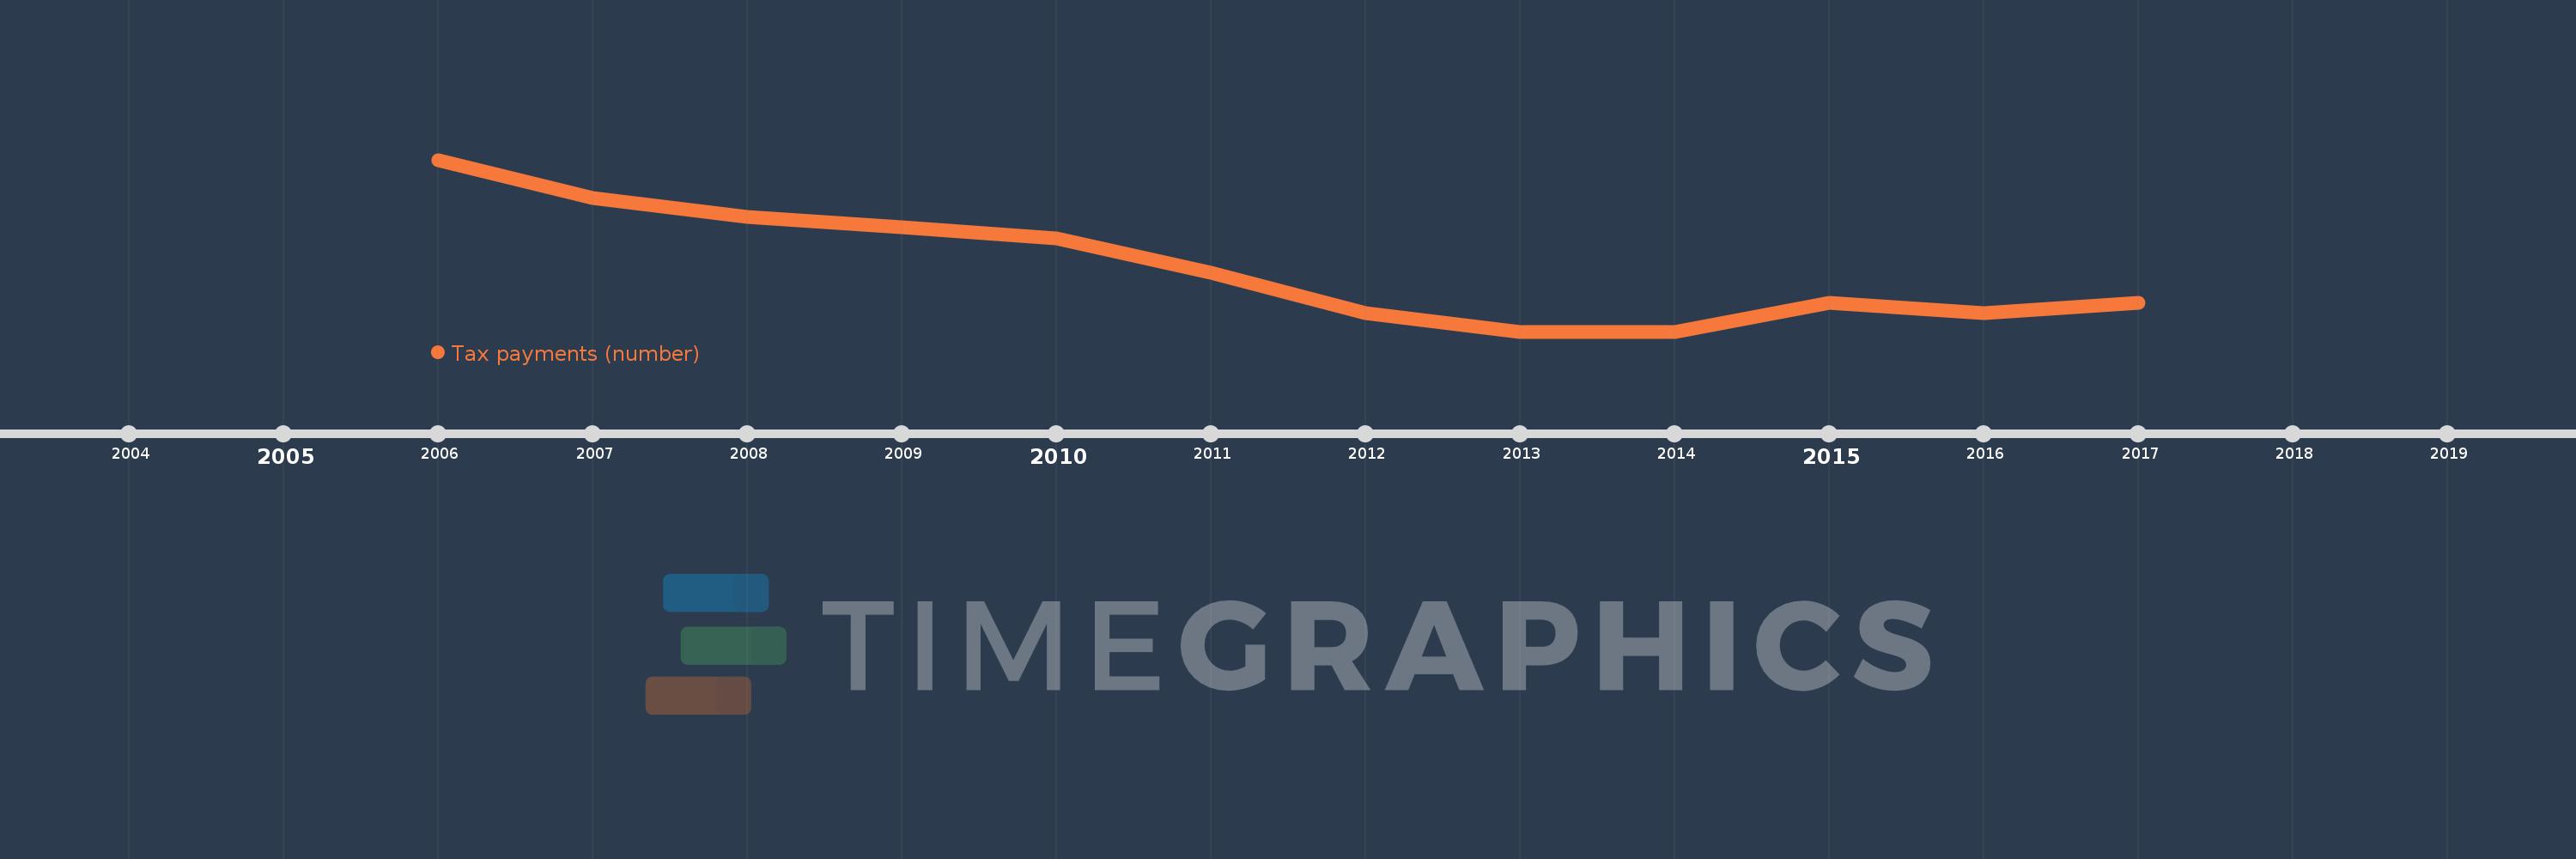
This timeline shows a graph from 2006 to 2017 of Sub-Saharan Africa (excluding high income). No data until 2005. Number of actual observations by date: 12.
Source name:
World Development Indicators
Source organization:
World Bank, Doing Business project (http://www.doingbusiness.org/).
Categories, topics:
Private Sector, Public Sector
Last updated:
apr 23, 2017
Indicators value changes by year
Meaning:
39.27
Minimum:
38.739
jan 1, 2013
Maximum:
40.159
jan 1, 2006
At the date of observation
Value
Absolute change
Change from the previous value
jan 1, 2006
40.159
+40.159
0.0%
jan 1, 2007
39.844
-0.315
-0.78%
jan 1, 2008
39.689
-0.156
-0.39%
jan 1, 2009
39.6
-0.089
-0.22%
jan 1, 2010
39.511
-0.089
-0.22%
jan 1, 2011
39.222
-0.289
-0.73%
jan 1, 2012
38.889
-0.333
-0.85%
jan 1, 2013
38.739
-0.15
-0.39%
jan 1, 2014
38.739
0.0
0.0%
jan 1, 2015
38.978
+0.239
0.62%
jan 1, 2016
38.891
-0.087
-0.22%
jan 1, 2017
38.978
+0.087
0.22%
Ranking of countries by current statistics by years