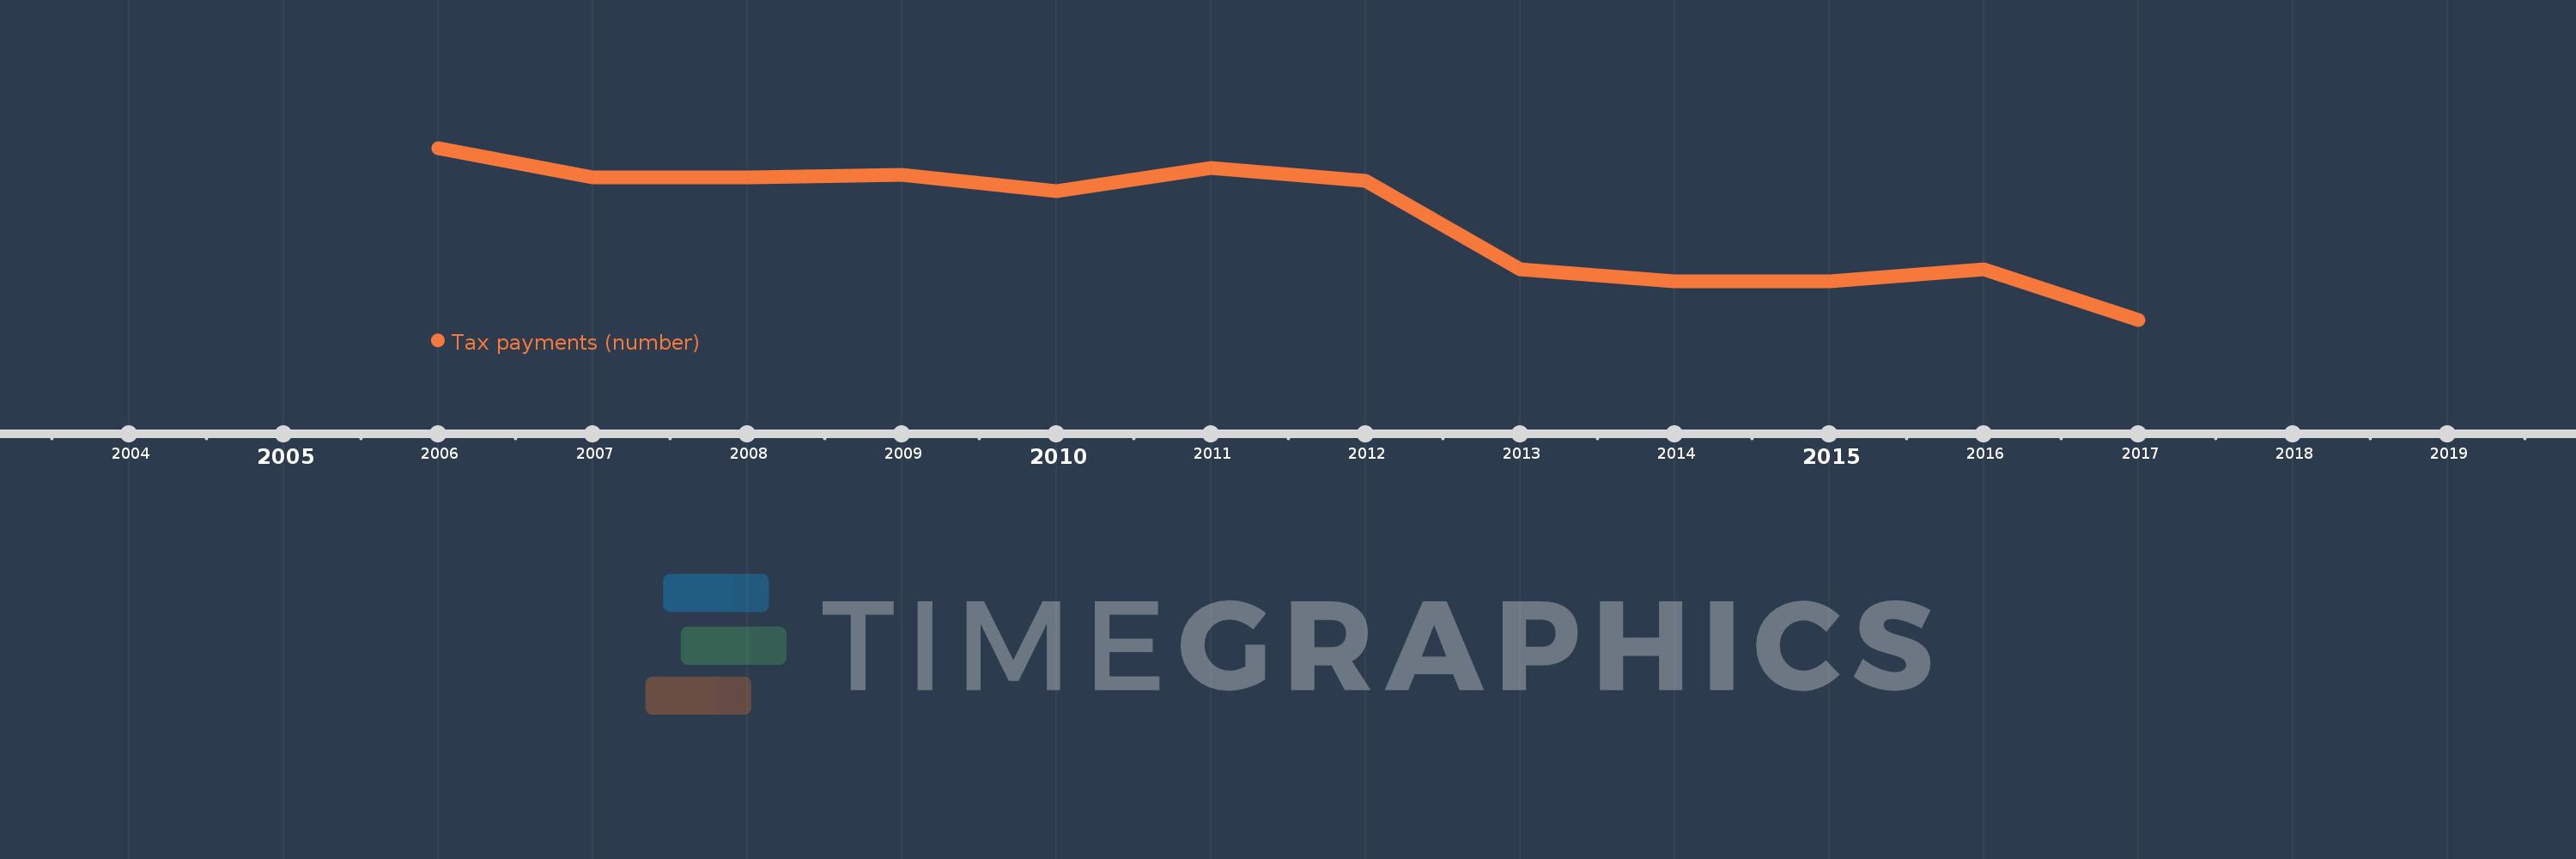
This timeline shows a graph from 2006 to 2017 of Fragile and conflict affected situations. No data until 2005. Number of actual observations by date: 12.
Source name:
World Development Indicators
Source organization:
World Bank, Doing Business project (http://www.doingbusiness.org/).
Categories, topics:
Private Sector, Public Sector
Last updated:
apr 23, 2017
Indicators value changes by year
Meaning:
34.84
Minimum:
33.576
jan 1, 2017
Maximum:
35.75
jan 1, 2006
At the date of observation
Value
Absolute change
Change from the previous value
jan 1, 2006
35.75
+35.75
0.0%
jan 1, 2007
35.379
-0.371
-1.04%
jan 1, 2008
35.379
0.0
0.0%
jan 1, 2009
35.414
+0.034
0.1%
jan 1, 2010
35.2
-0.214
-0.6%
jan 1, 2011
35.5
+0.3
0.85%
jan 1, 2012
35.333
-0.167
-0.47%
jan 1, 2013
34.212
-1.121
-3.17%
jan 1, 2014
34.061
-0.152
-0.44%
jan 1, 2015
34.061
0.0
0.0%
jan 1, 2016
34.212
+0.152
0.44%
jan 1, 2017
33.576
-0.636
-1.86%
Ranking of countries by current statistics by years