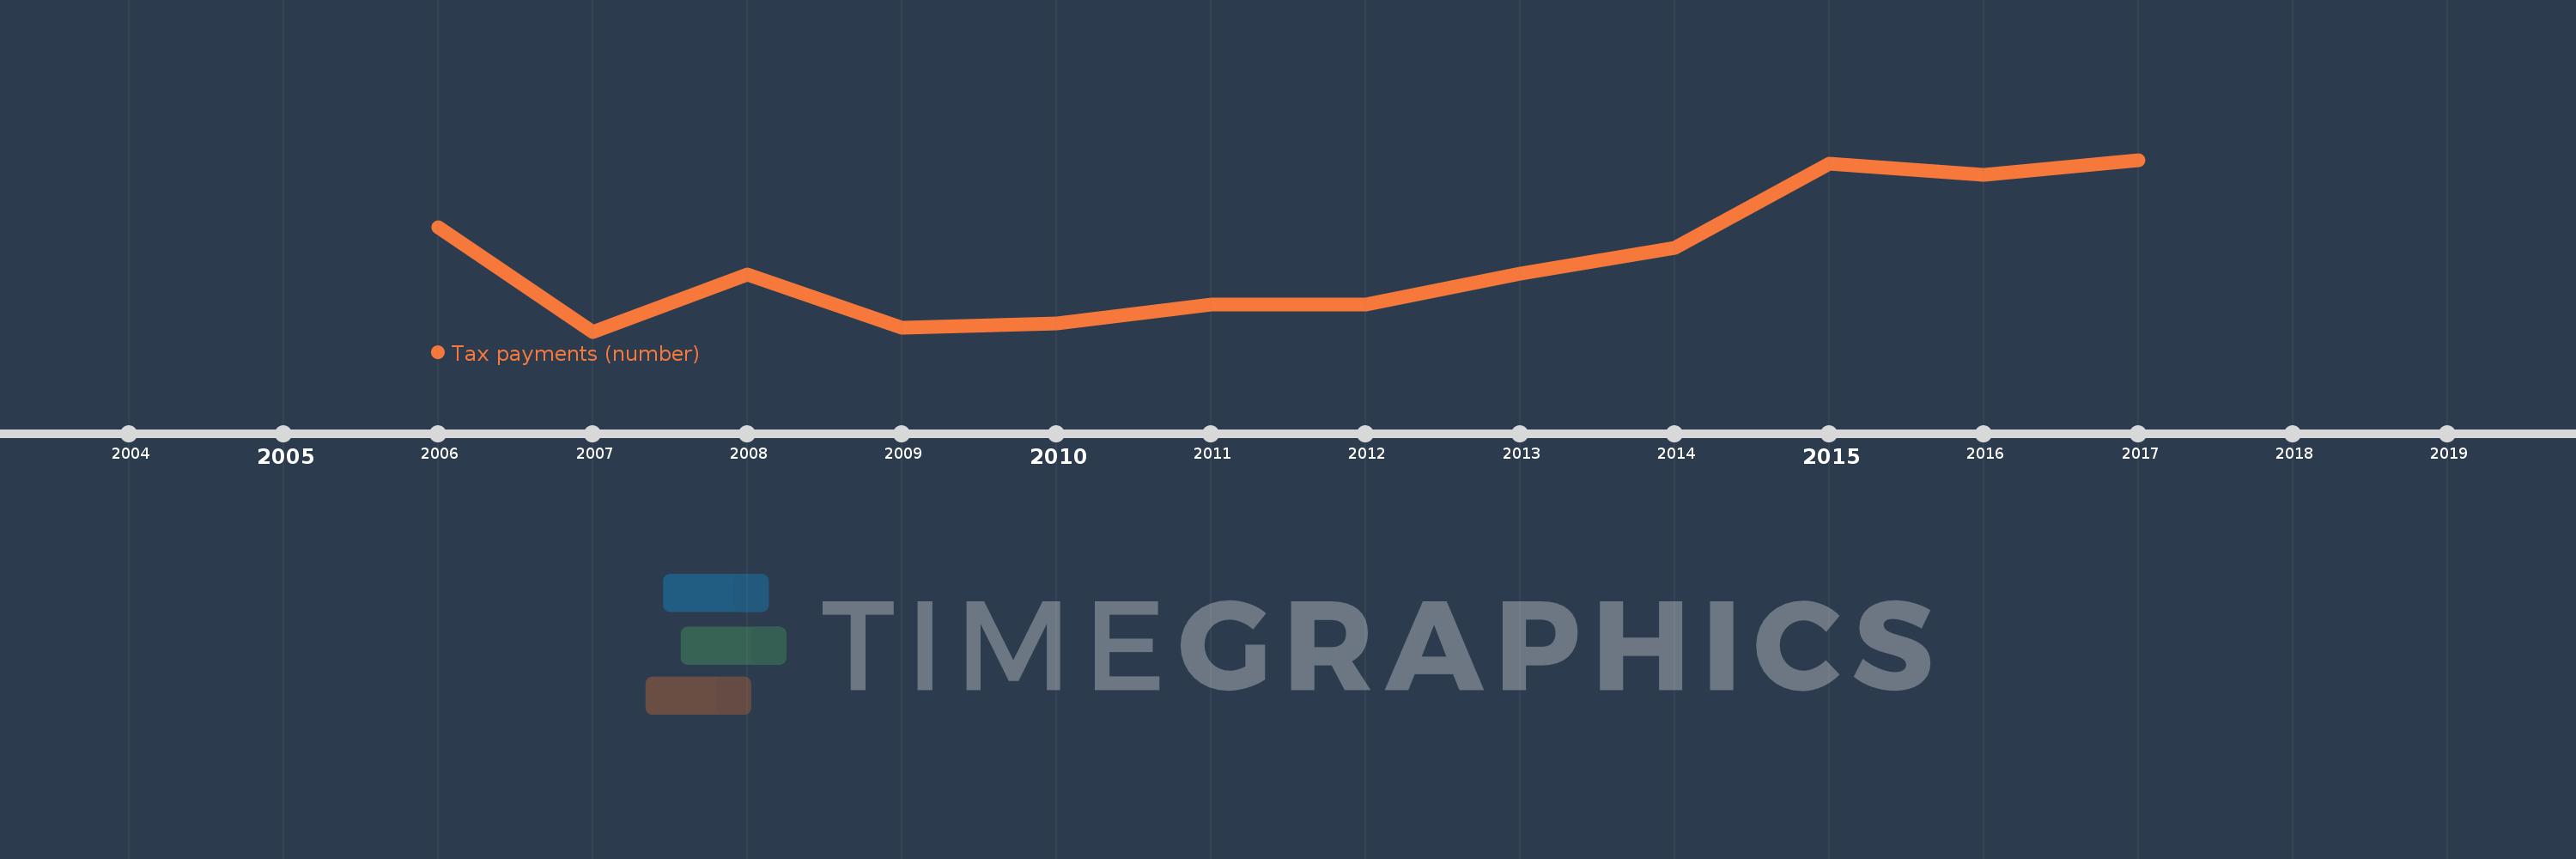
This timeline shows a graph from 2006 to 2017 of Least developed countries: UN classification. No data until 2005. Number of actual observations by date: 12.
Source name:
World Development Indicators
Source organization:
World Bank, Doing Business project (http://www.doingbusiness.org/).
Categories, topics:
Private Sector, Public Sector
Last updated:
apr 23, 2017
Indicators value changes by year
Meaning:
36.996
Minimum:
36.568
jan 1, 2007
Maximum:
37.587
jan 1, 2017
At the date of observation
Value
Absolute change
Change from the previous value
jan 1, 2006
37.186
+37.186
0.0%
jan 1, 2007
36.568
-0.618
-1.66%
jan 1, 2008
36.909
+0.341
0.93%
jan 1, 2009
36.591
-0.318
-0.86%
jan 1, 2010
36.614
+0.023
0.06%
jan 1, 2011
36.727
+0.114
0.31%
jan 1, 2012
36.727
0.0
0.0%
jan 1, 2013
36.913
+0.186
0.51%
jan 1, 2014
37.065
+0.152
0.41%
jan 1, 2015
37.565
+0.5
1.35%
jan 1, 2016
37.5
-0.065
-0.17%
jan 1, 2017
37.587
+0.087
0.23%
Ranking of countries by current statistics by years