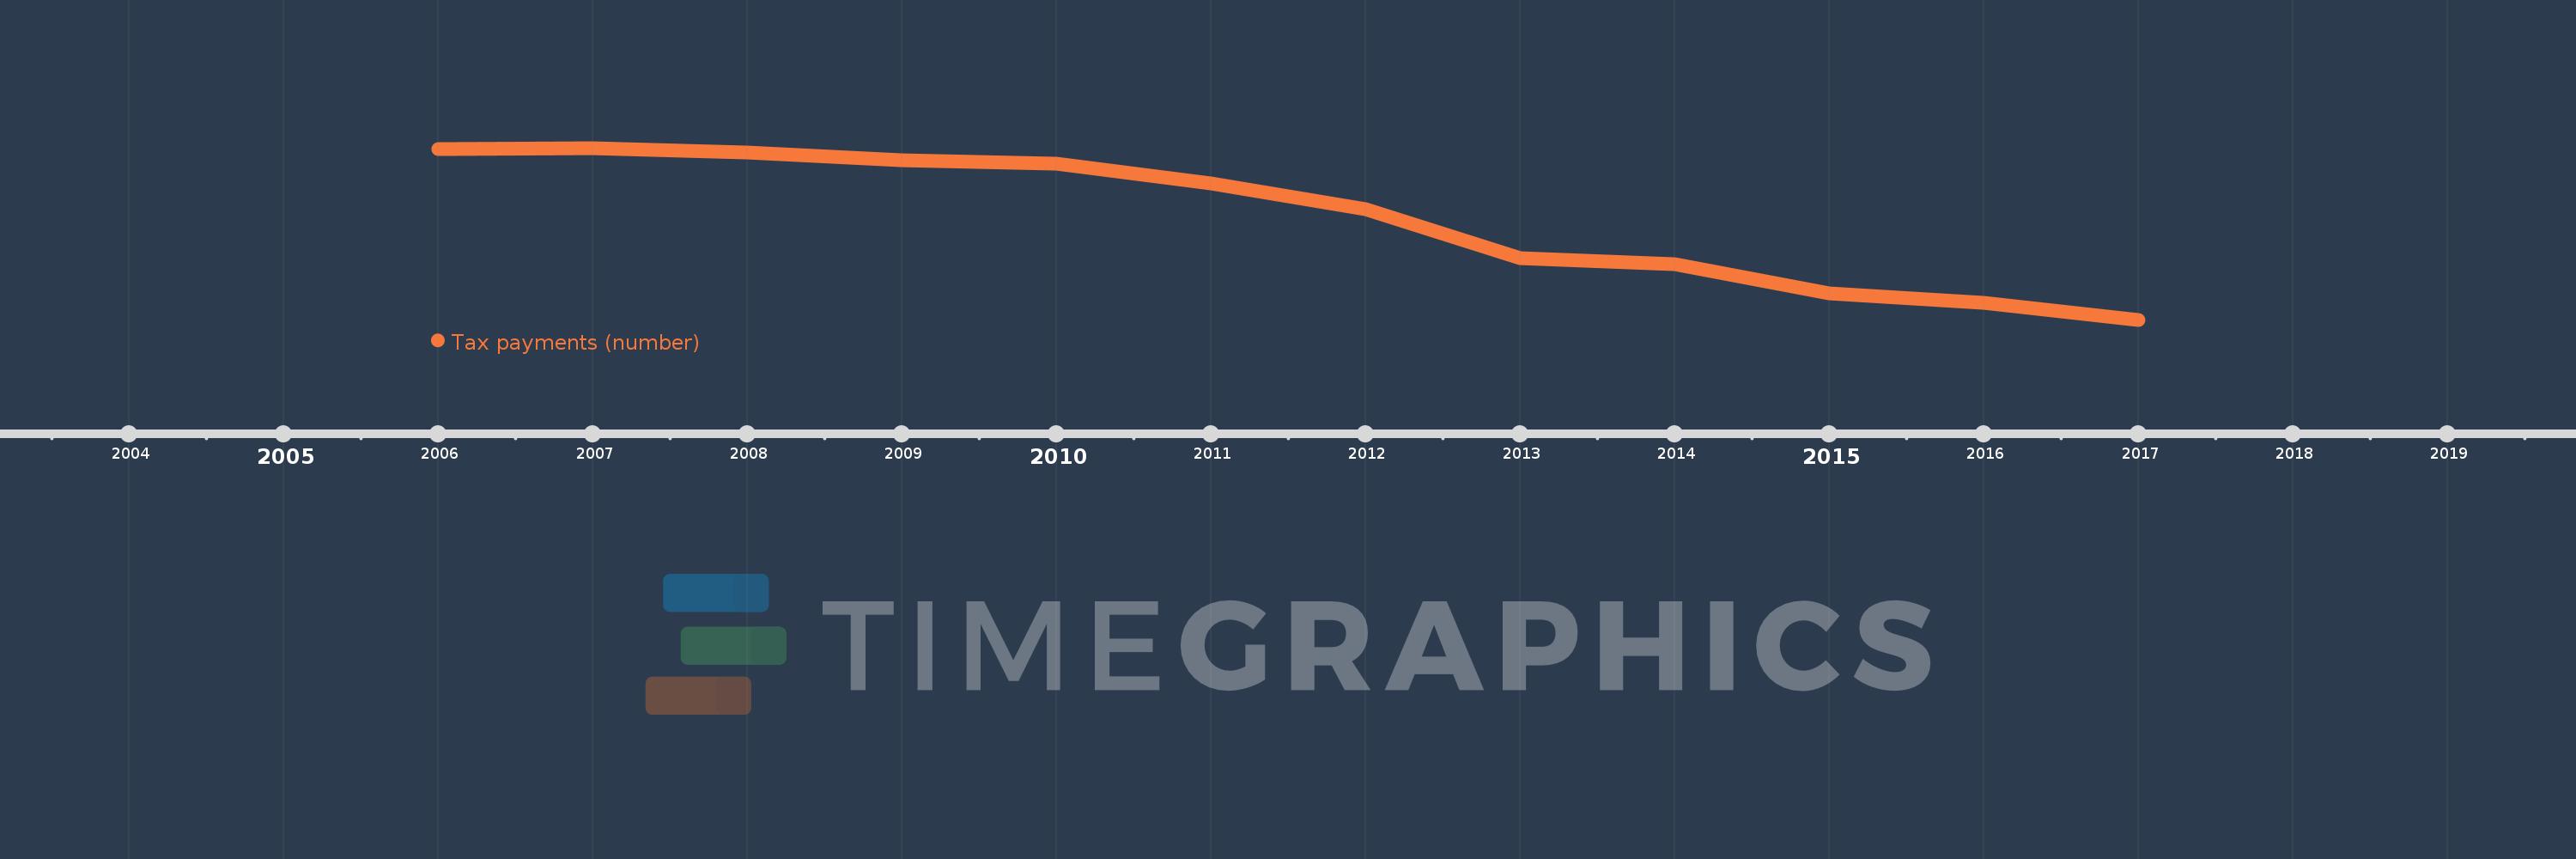
This timeline shows a graph from 2006 to 2017 of Europe & Central Asia (excluding high income). No data until 2005. Number of actual observations by date: 12.
Source name:
World Development Indicators
Source organization:
World Bank, Doing Business project (http://www.doingbusiness.org/).
Categories, topics:
Private Sector, Public Sector
Last updated:
apr 23, 2017
Indicators value changes by year
Meaning:
41.952
Minimum:
17.25
jan 1, 2017
Maximum:
58.579
jan 1, 2007
At the date of observation
Value
Absolute change
Change from the previous value
jan 1, 2006
58.333
+58.333
0.0%
jan 1, 2007
58.579
+0.246
0.42%
jan 1, 2008
57.474
-1.105
-1.89%
jan 1, 2009
55.684
-1.789
-3.11%
jan 1, 2010
54.7
-0.984
-1.77%
jan 1, 2011
50.05
-4.65
-8.5%
jan 1, 2012
43.75
-6.3
-12.59%
jan 1, 2013
32.1
-11.65
-26.63%
jan 1, 2014
30.7
-1.4
-4.36%
jan 1, 2015
23.5
-7.2
-23.45%
jan 1, 2016
21.3
-2.2
-9.36%
jan 1, 2017
17.25
-4.05
-19.01%
Ranking of countries by current statistics by years