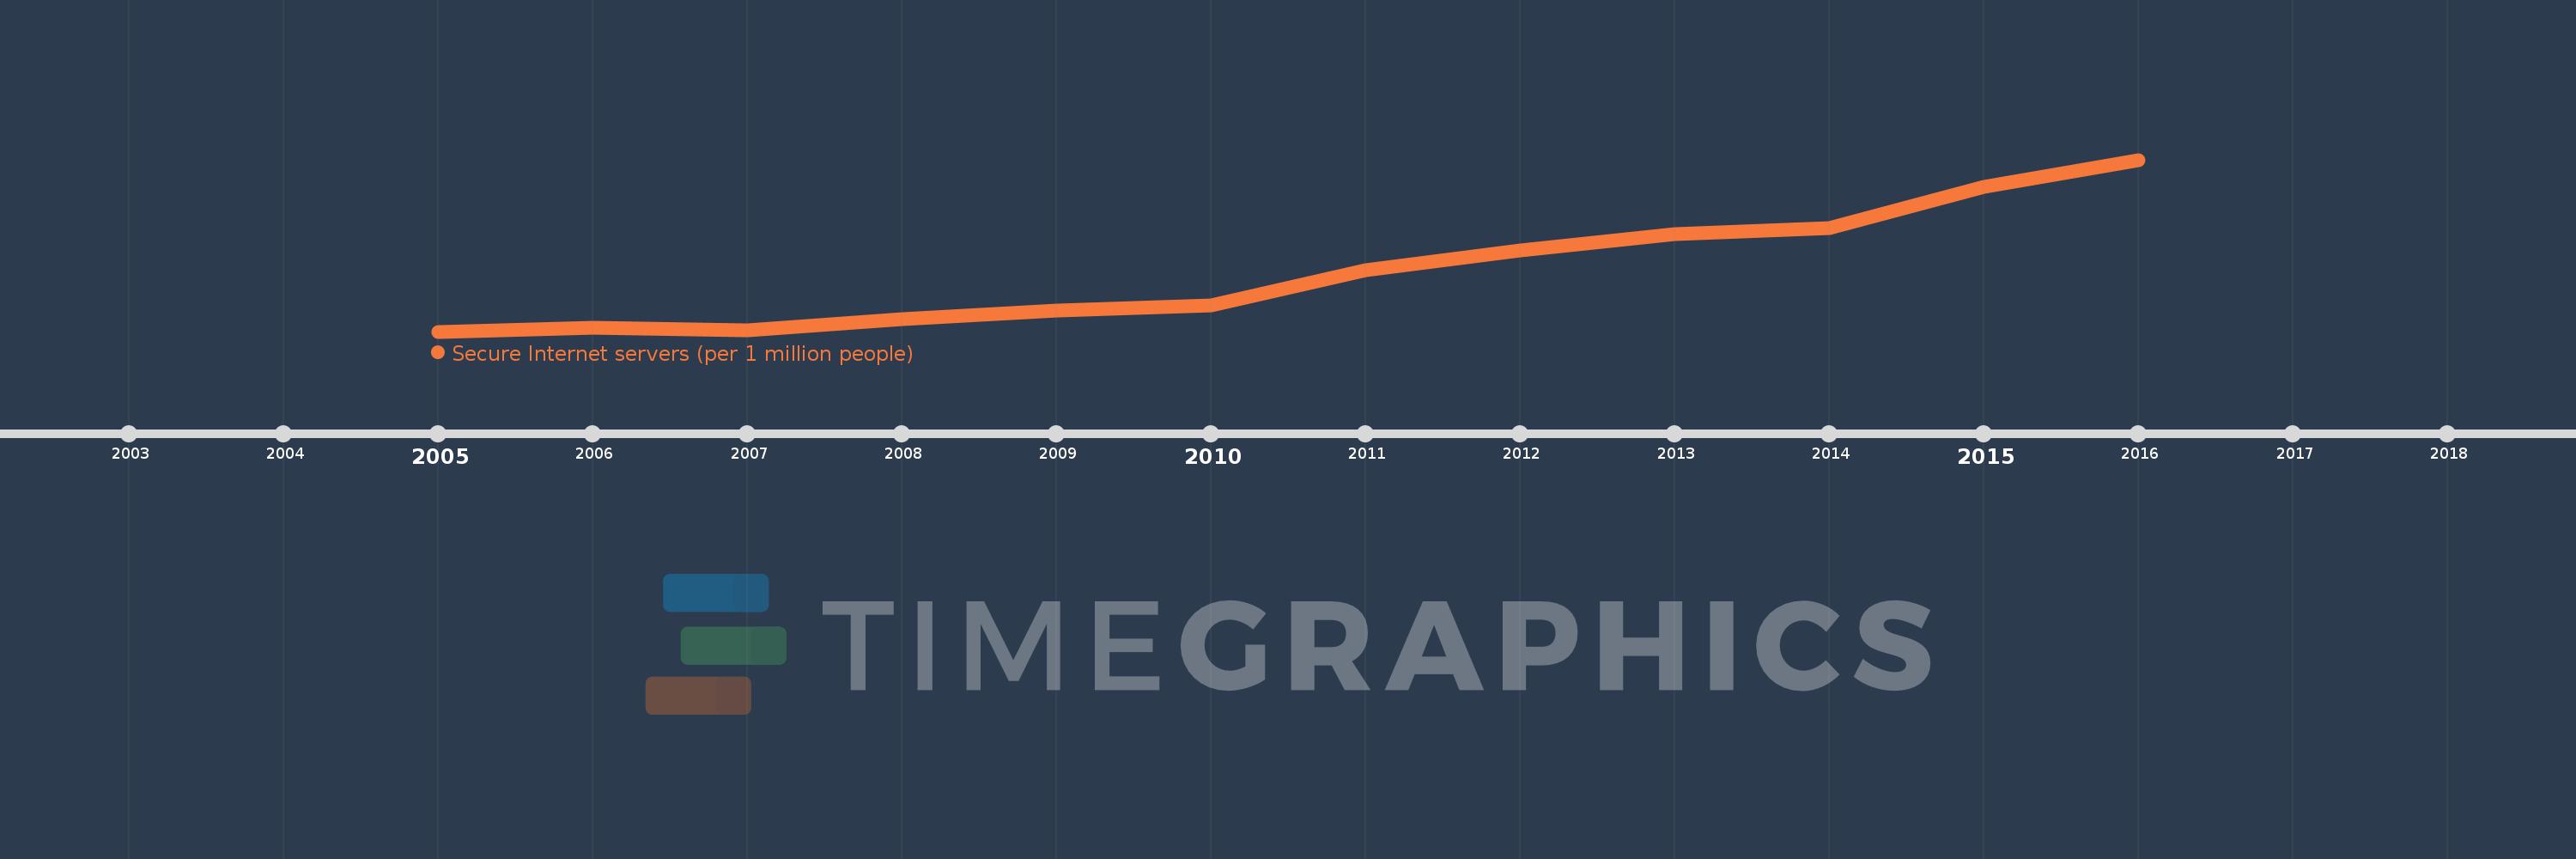
This timeline shows a graph from 2005 to 2016 of Sub-Saharan Africa (excluding high income). No data until 2004. Number of actual observations by date: 12.
Source name:
World Development Indicators
Source organization:
Netcraft (http://www.netcraft.com/) and World Bank population estimates.
Categories, topics:
Infrastructure
Last updated:
apr 23, 2017
Indicators value changes by year
Meaning:
4.644
Minimum:
1.819
jan 1, 2005
Maximum:
9.834
jan 1, 2016
At the date of observation
Value
Absolute change
Change from the previous value
jan 1, 2005
1.819
+1.819
0.0%
jan 1, 2006
2.002
+0.183
10.06%
jan 1, 2007
1.892
-0.11
-5.49%
jan 1, 2008
2.412
+0.519
27.44%
jan 1, 2009
2.816
+0.405
16.79%
jan 1, 2010
3.06
+0.244
8.65%
jan 1, 2011
4.699
+1.639
53.57%
jan 1, 2012
5.624
+0.925
19.67%
jan 1, 2013
6.359
+0.735
13.07%
jan 1, 2014
6.648
+0.288
4.53%
jan 1, 2015
8.568
+1.92
28.88%
jan 1, 2016
9.834
+1.266
14.77%
Ranking of countries by current statistics by years