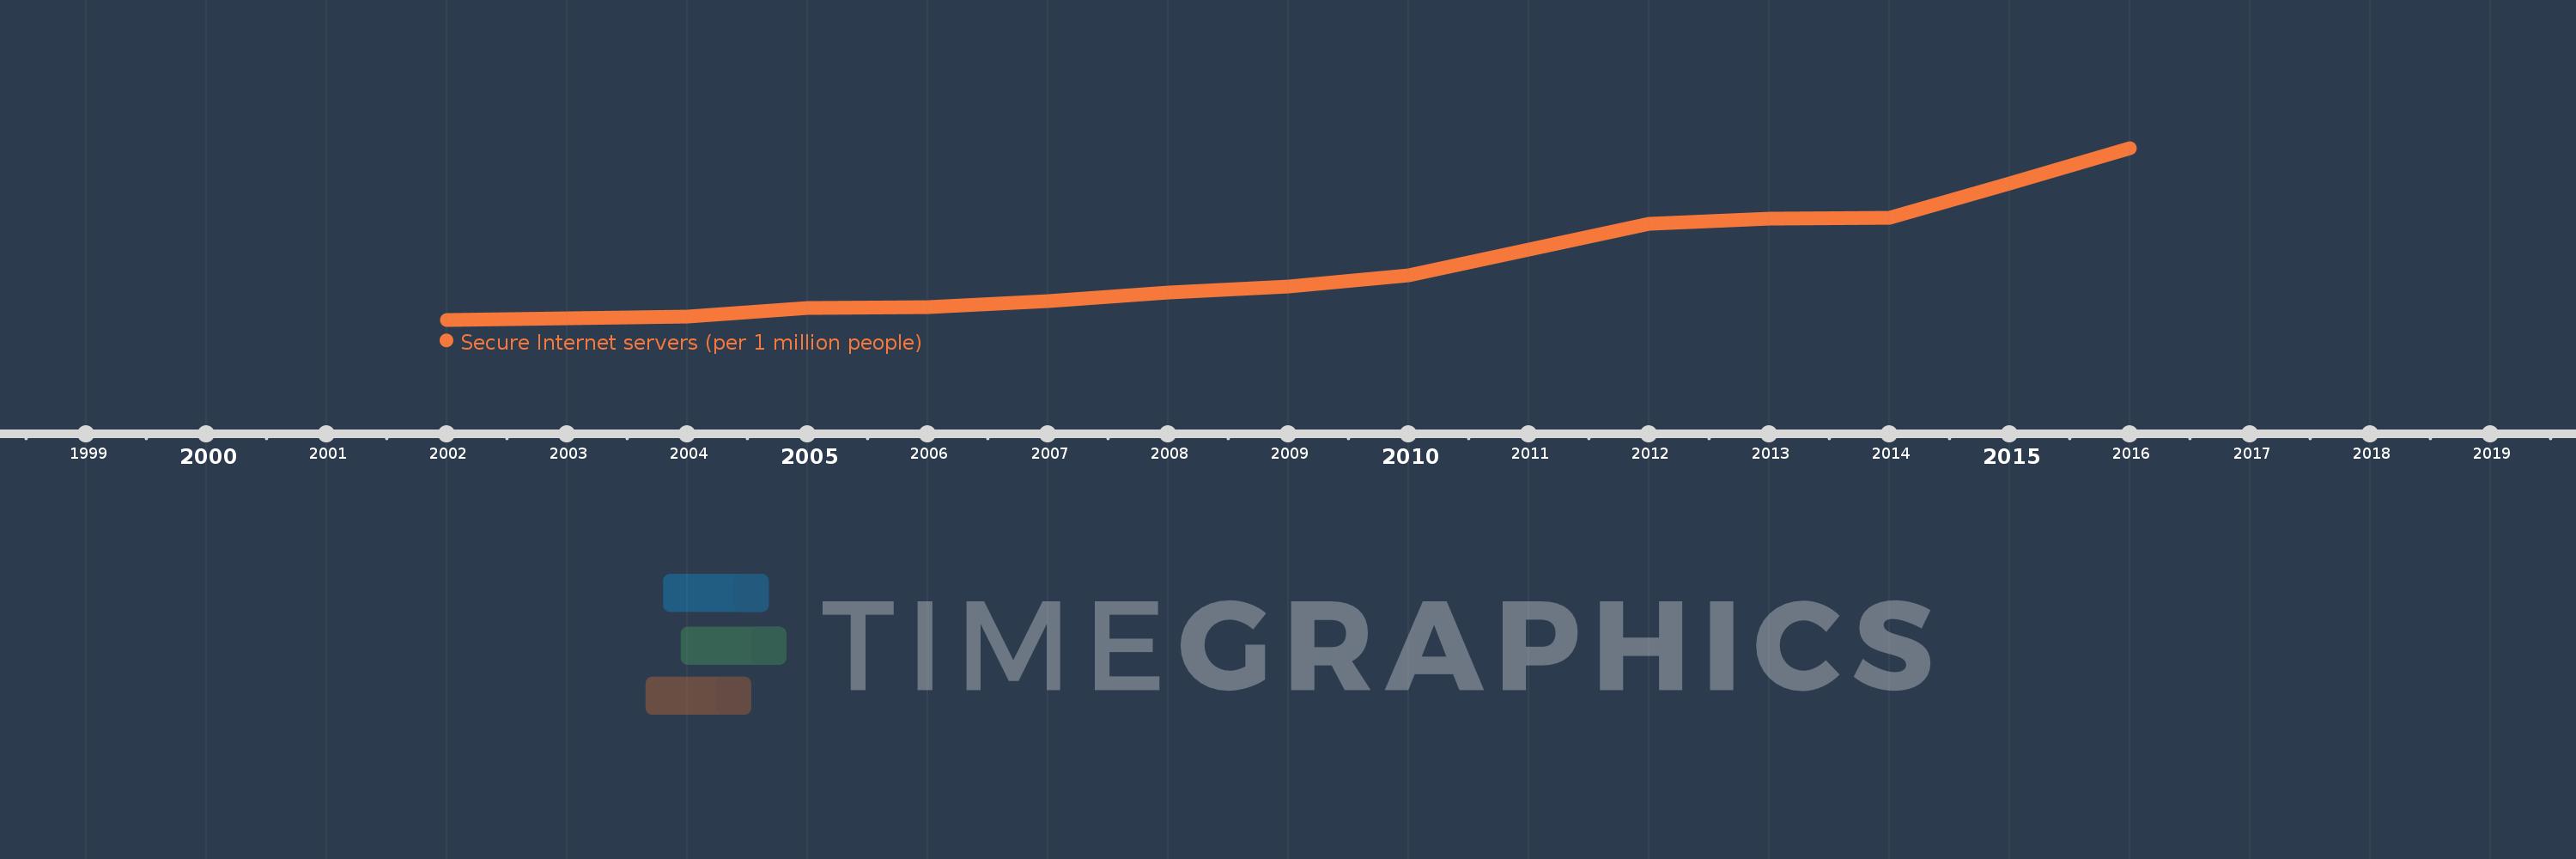
This timeline shows a graph from 2002 to 2016 of Middle East & North Africa (excluding high income). No data until 2001. Number of actual observations by date: 14.
Source name:
World Development Indicators
Source organization:
Netcraft (http://www.netcraft.com/) and World Bank population estimates.
Categories, topics:
Infrastructure
Last updated:
apr 23, 2017
Indicators value changes by year
Meaning:
2.064
Minimum:
0.215
jan 1, 2002
Maximum:
5.588
jan 1, 2016
At the date of observation
Value
Absolute change
Change from the previous value
jan 1, 2002
0.215
+0.215
0.0%
jan 1, 2004
0.315
+0.101
46.88%
jan 1, 2005
0.581
+0.265
84.12%
jan 1, 2006
0.609
+0.028
4.9%
jan 1, 2007
0.785
+0.175
28.77%
jan 1, 2008
1.07
+0.285
36.33%
jan 1, 2009
1.246
+0.176
16.5%
jan 1, 2010
1.61
+0.364
29.23%
jan 1, 2011
2.407
+0.797
49.49%
jan 1, 2012
3.214
+0.807
33.51%
jan 1, 2013
3.387
+0.173
5.39%
jan 1, 2014
3.408
+0.021
0.61%
jan 1, 2015
4.466
+1.058
31.04%
jan 1, 2016
5.588
+1.122
25.13%
Ranking of countries by current statistics by years