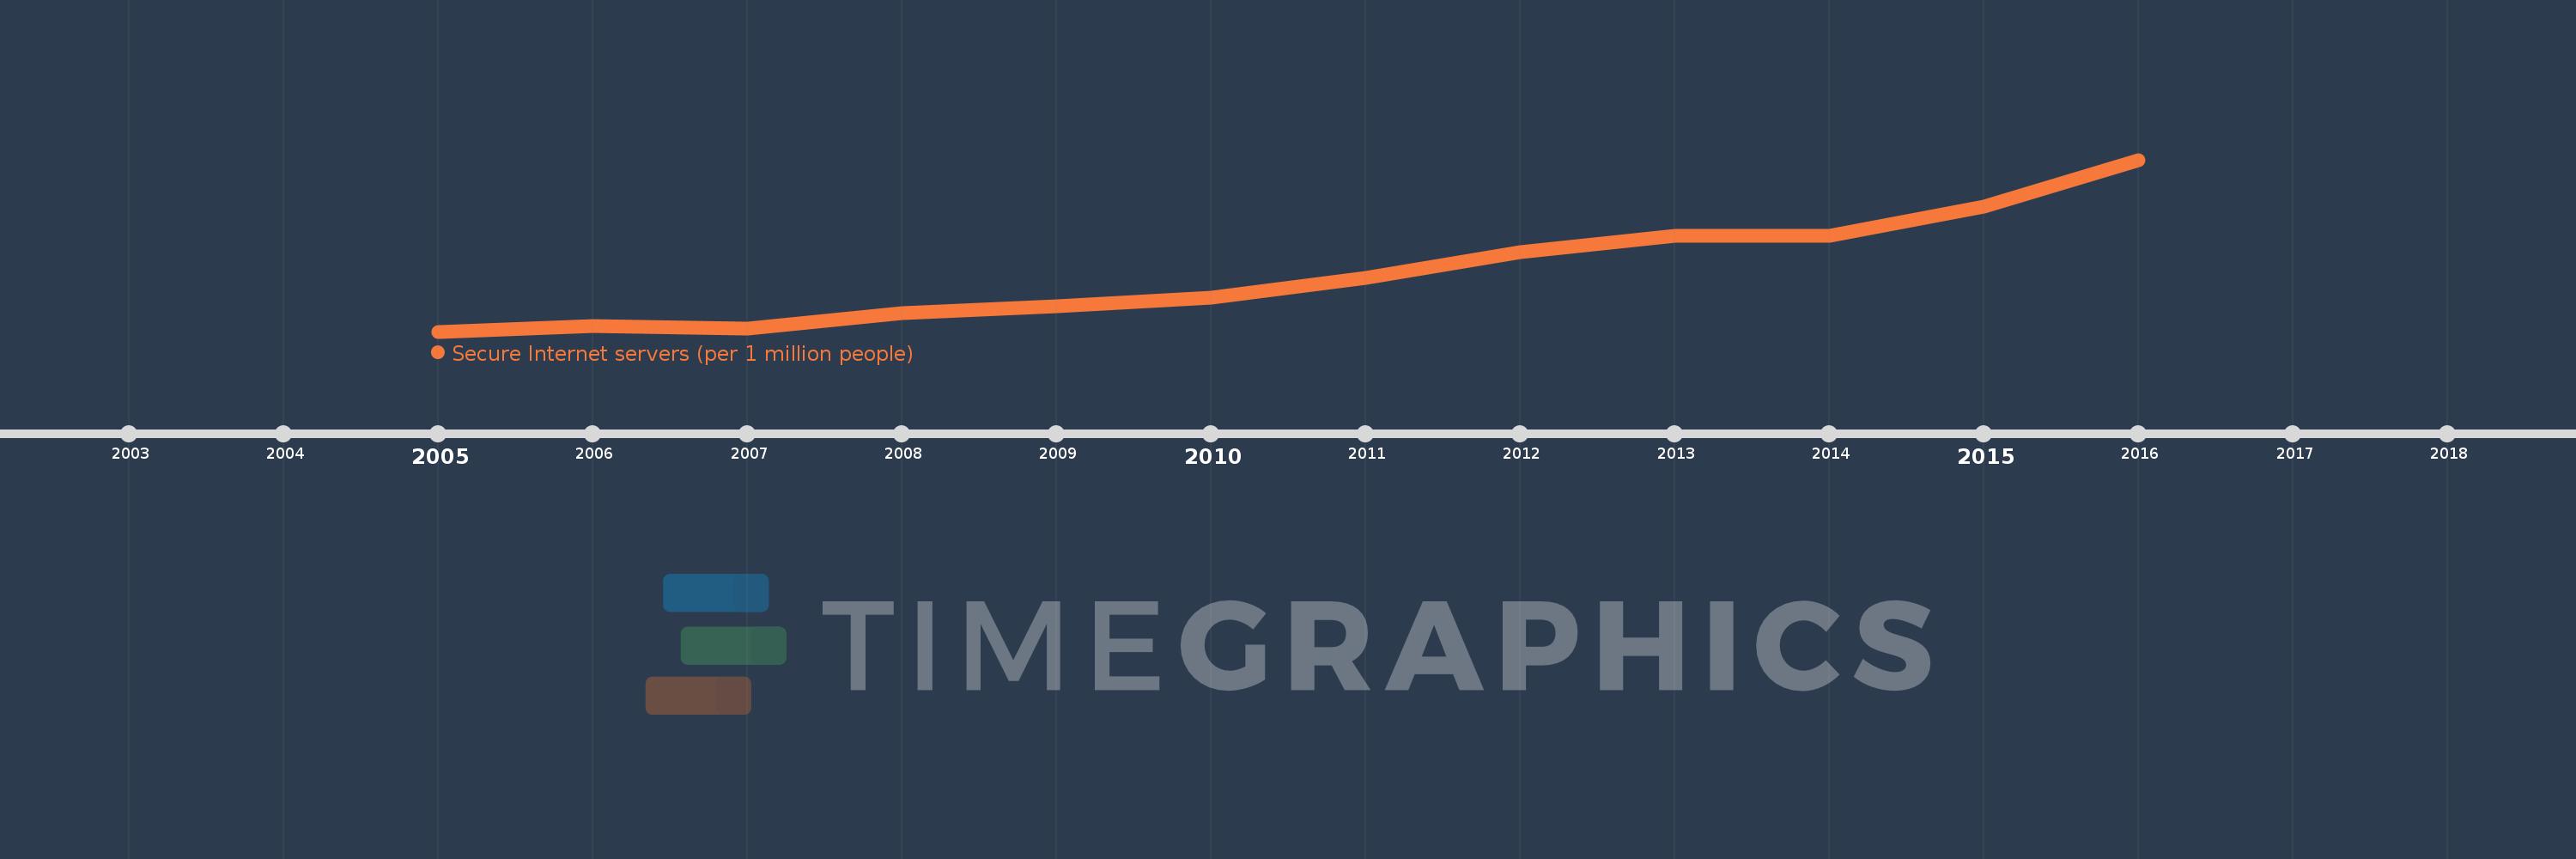
This timeline shows a graph from 2005 to 2016 of Least developed countries: UN classification. No data until 2004. Number of actual observations by date: 12.
Source name:
World Development Indicators
Source organization:
Netcraft (http://www.netcraft.com/) and World Bank population estimates.
Categories, topics:
Infrastructure
Last updated:
apr 23, 2017
Indicators value changes by year
Meaning:
0.625
Minimum:
0.123
jan 1, 2005
Maximum:
1.584
jan 1, 2016
At the date of observation
Value
Absolute change
Change from the previous value
jan 1, 2005
0.123
+0.123
0.0%
jan 1, 2006
0.173
+0.05
40.76%
jan 1, 2007
0.149
-0.024
-13.96%
jan 1, 2008
0.28
+0.131
87.79%
jan 1, 2009
0.335
+0.055
19.63%
jan 1, 2010
0.415
+0.08
23.84%
jan 1, 2011
0.583
+0.168
40.39%
jan 1, 2012
0.796
+0.213
36.61%
jan 1, 2013
0.936
+0.14
17.58%
jan 1, 2014
0.938
+0.002
0.21%
jan 1, 2015
1.188
+0.249
26.59%
jan 1, 2016
1.584
+0.396
33.34%
Ranking of countries by current statistics by years