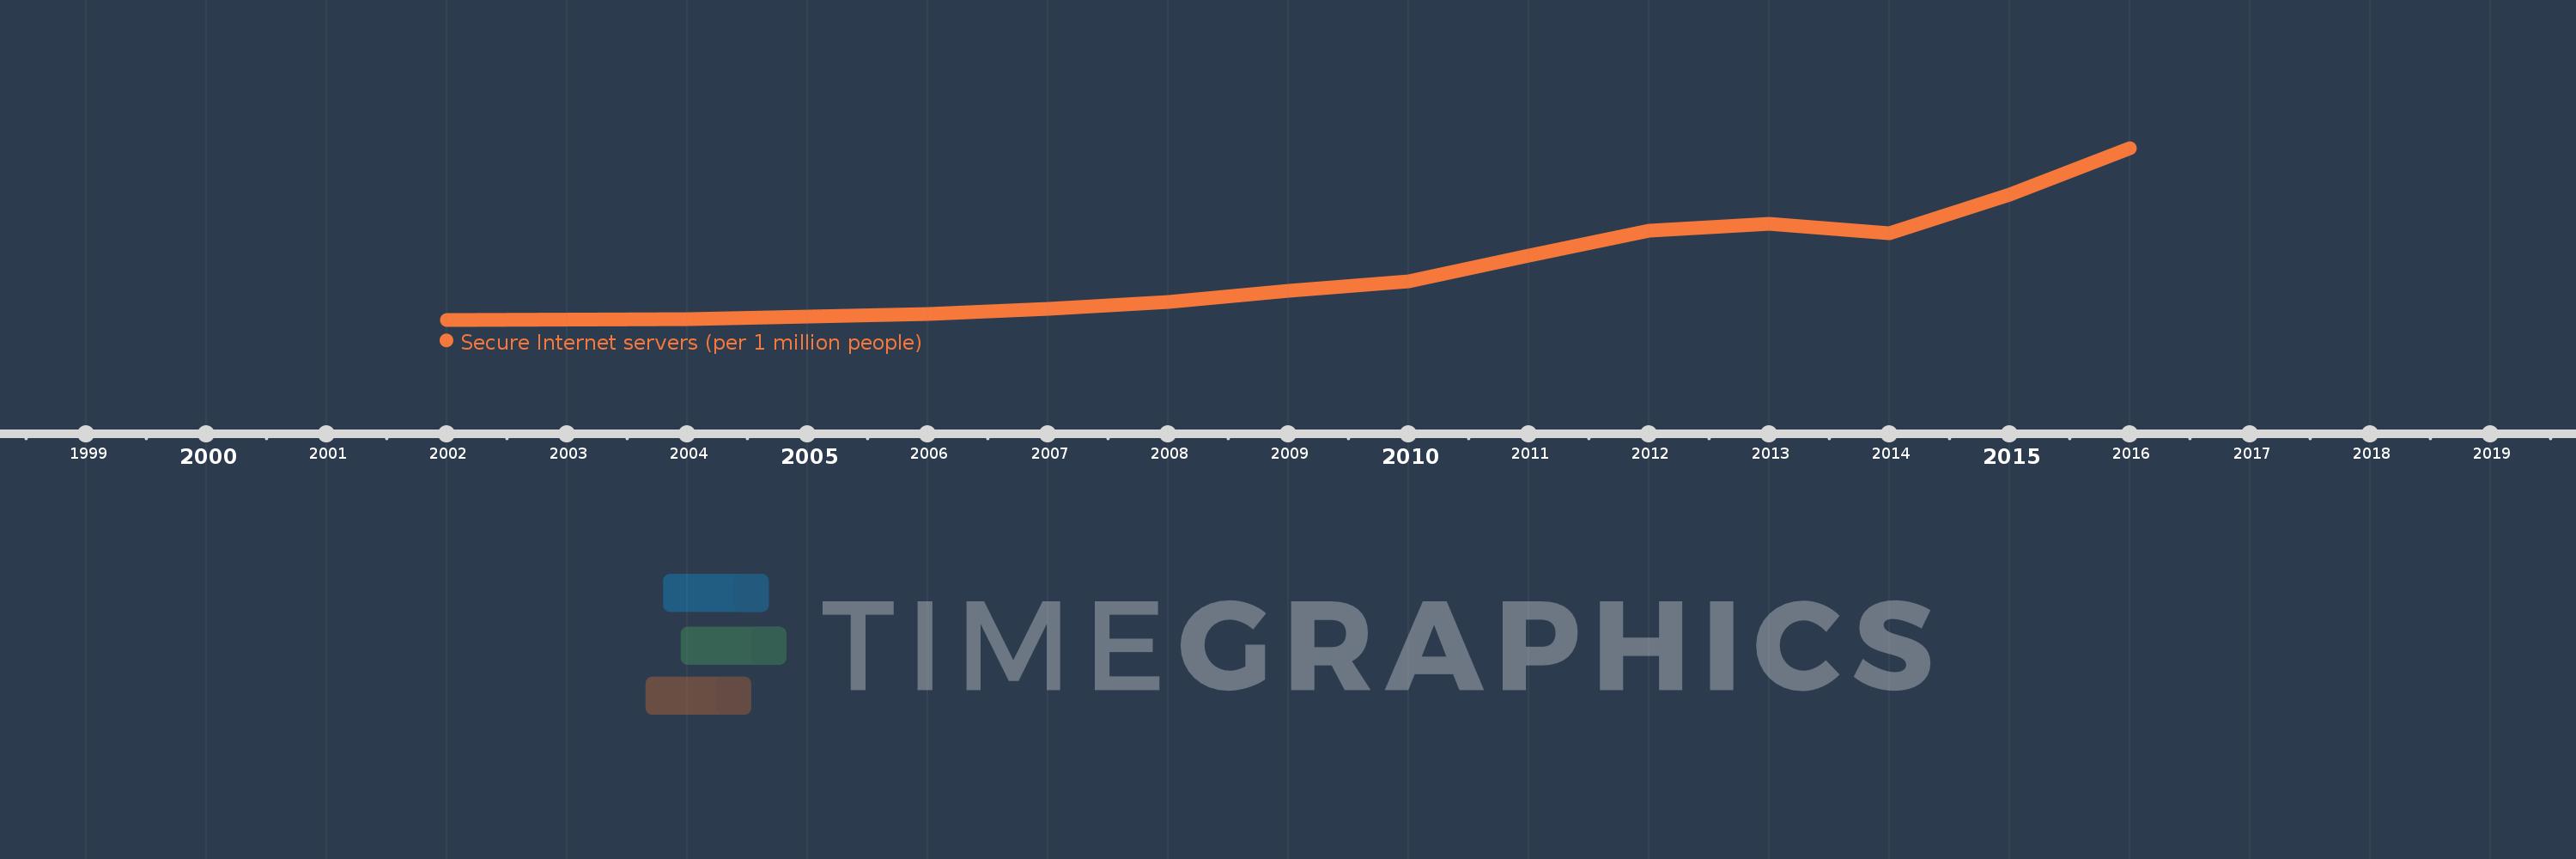
This timeline shows a graph from 2002 to 2016 of Europe & Central Asia (IDA & IBRD countries). No data until 2001. Number of actual observations by date: 14.
Source name:
World Development Indicators
Source organization:
Netcraft (http://www.netcraft.com/) and World Bank population estimates.
Categories, topics:
Infrastructure
Last updated:
apr 23, 2017
Indicators value changes by year
Meaning:
40.602
Minimum:
2.7
jan 1, 2002
Maximum:
126.194
jan 1, 2016
At the date of observation
Value
Absolute change
Change from the previous value
jan 1, 2002
2.7
+2.7
0.0%
jan 1, 2004
3.246
+0.545
20.2%
jan 1, 2005
5.1
+1.854
57.12%
jan 1, 2006
7.037
+1.937
37.99%
jan 1, 2007
10.343
+3.306
46.97%
jan 1, 2008
15.585
+5.242
50.68%
jan 1, 2009
23.31
+7.726
49.57%
jan 1, 2010
30.056
+6.745
28.94%
jan 1, 2011
49.081
+19.025
63.3%
jan 1, 2012
66.923
+17.842
36.35%
jan 1, 2013
71.445
+4.522
6.76%
jan 1, 2014
64.672
-6.773
-9.48%
jan 1, 2015
92.733
+28.061
43.39%
jan 1, 2016
126.194
+33.461
36.08%
Ranking of countries by current statistics by years