33
/
AIzaSyB4mHJ5NPEv-XzF7P6NDYXjlkCWaeKw5bc
November 30, 2025
60206
Sub-Saharan Africa (excluding high income)
SSA
false
2
1
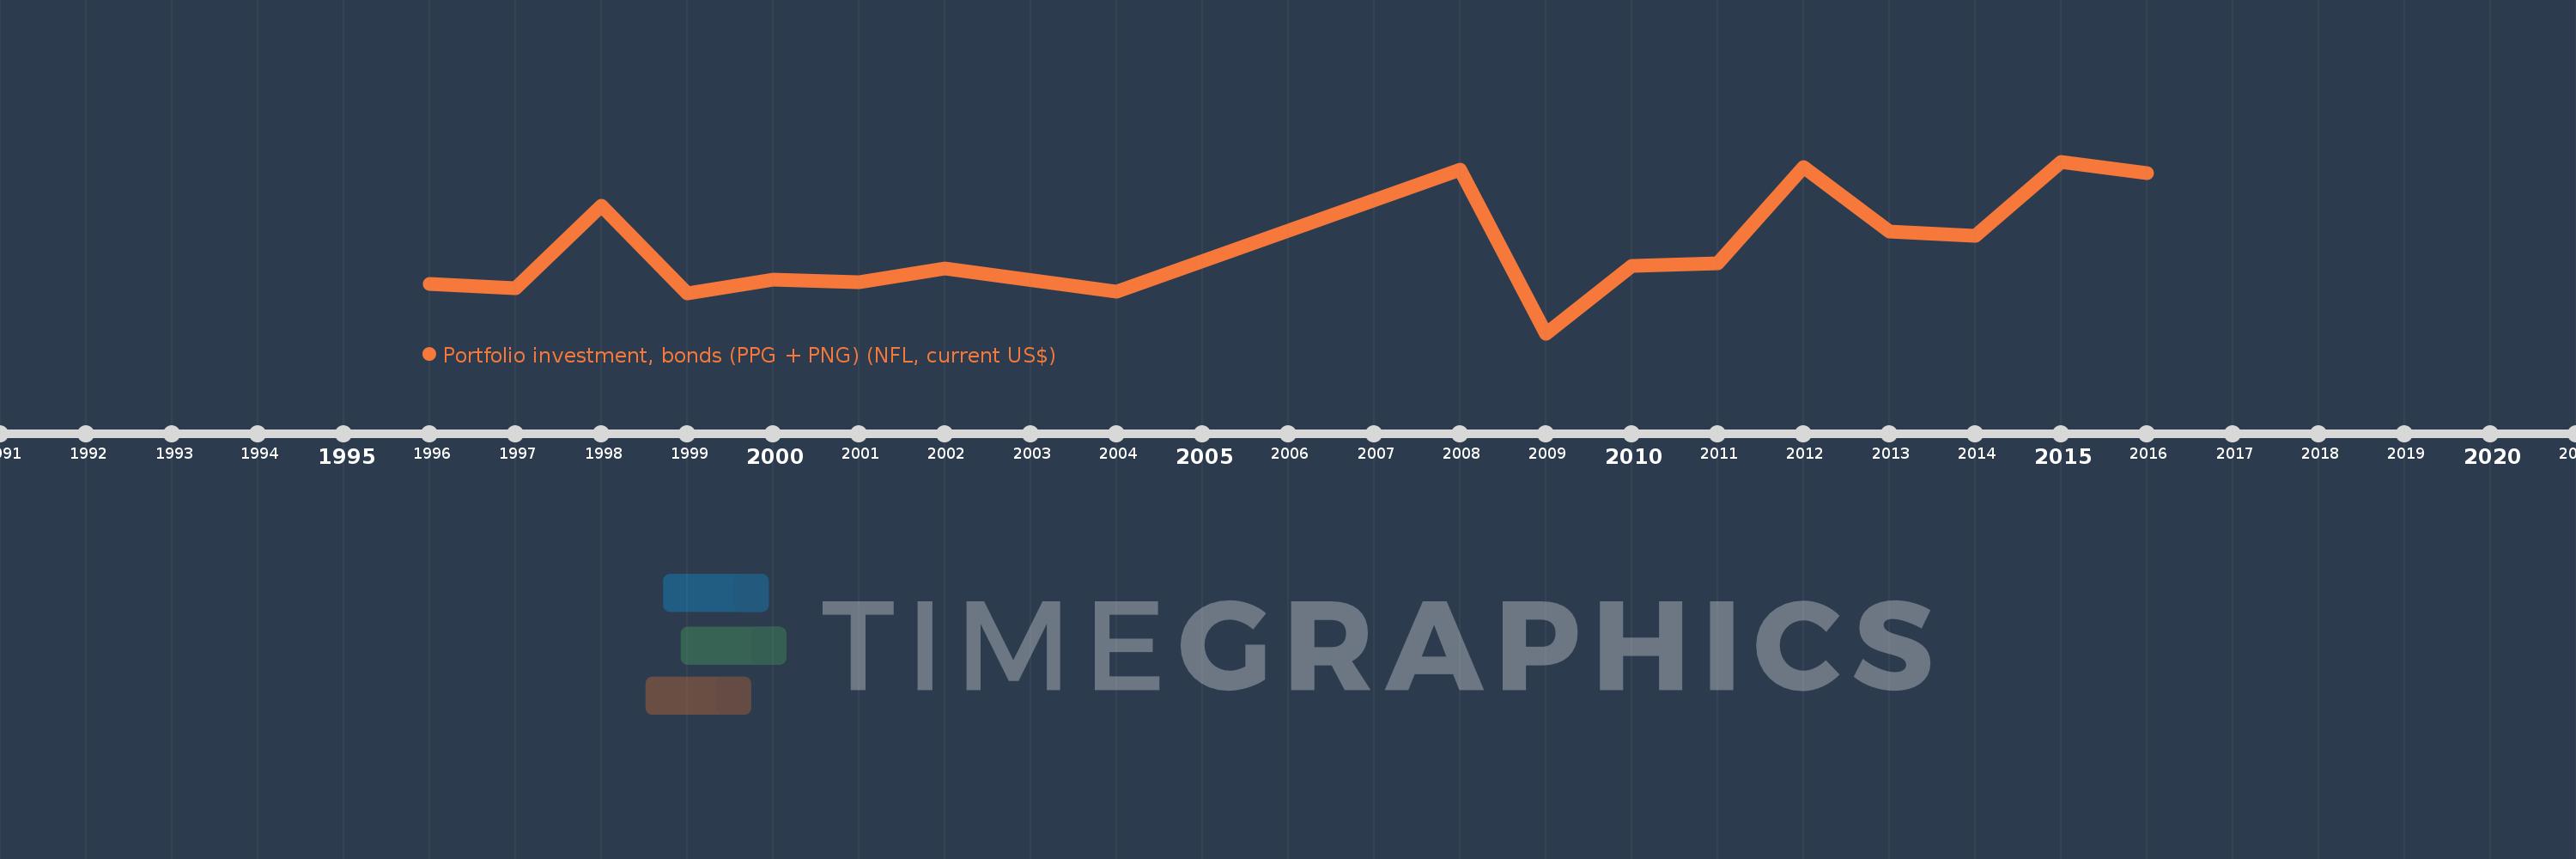
Portfolio investment, bonds (PPG + PNG) (NFL, current US$)
2016,2015,2014,2013,2012,2011,2010,2009,2008,2004,2002,2001,2000,1999,1998,1997,1996