33
/
AIzaSyB4mHJ5NPEv-XzF7P6NDYXjlkCWaeKw5bc
November 30, 2025
125324
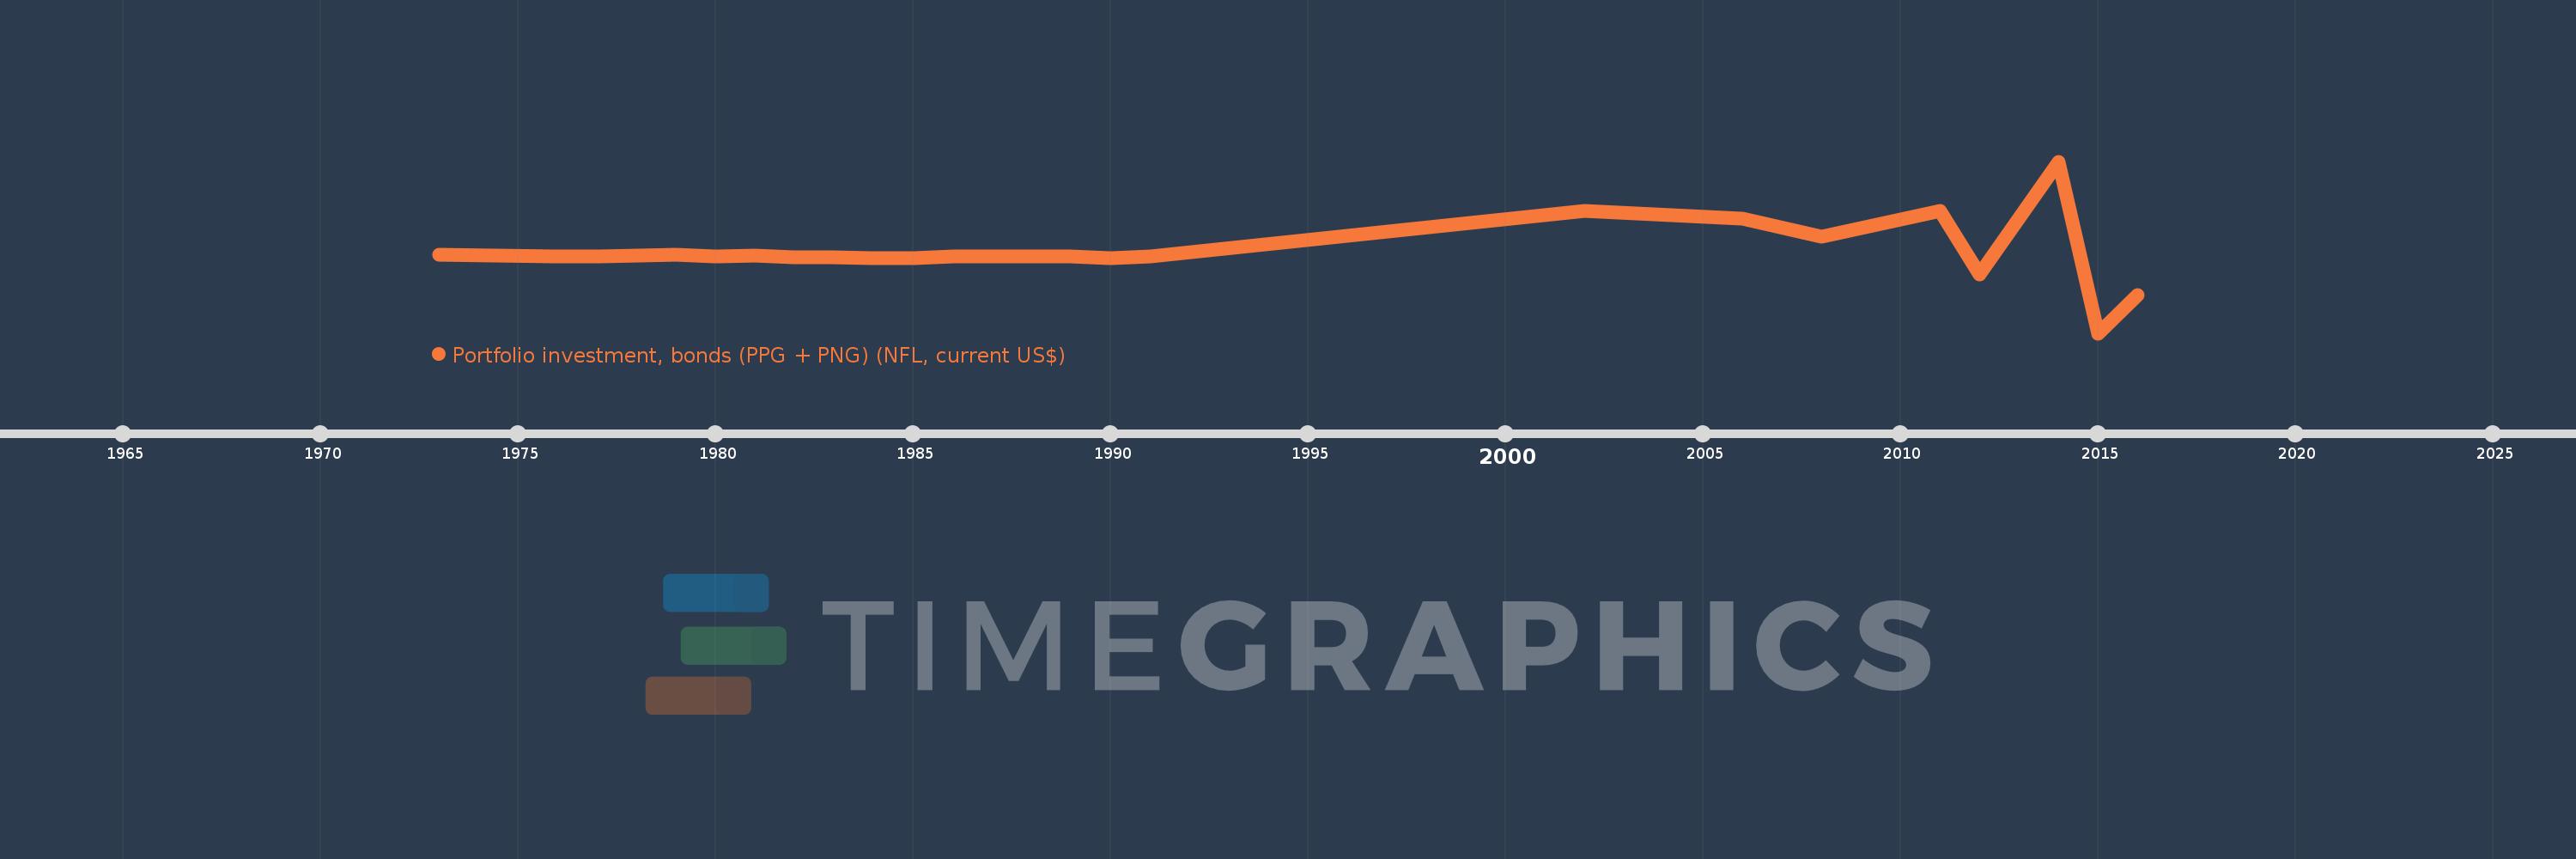
Egypt, Arab Rep.
EGY
true
2
1
Portfolio investment, bonds (PPG + PNG) (NFL, current US$)
2016,2015,2014,2012,2011,2008,2006,2002,1991,1990,1989,1988,1987,1986,1985,1984,1983,1982,1981,1980,1979,1978,1977,1976,1973