33
/
AIzaSyB4mHJ5NPEv-XzF7P6NDYXjlkCWaeKw5bc
November 30, 2025
135981
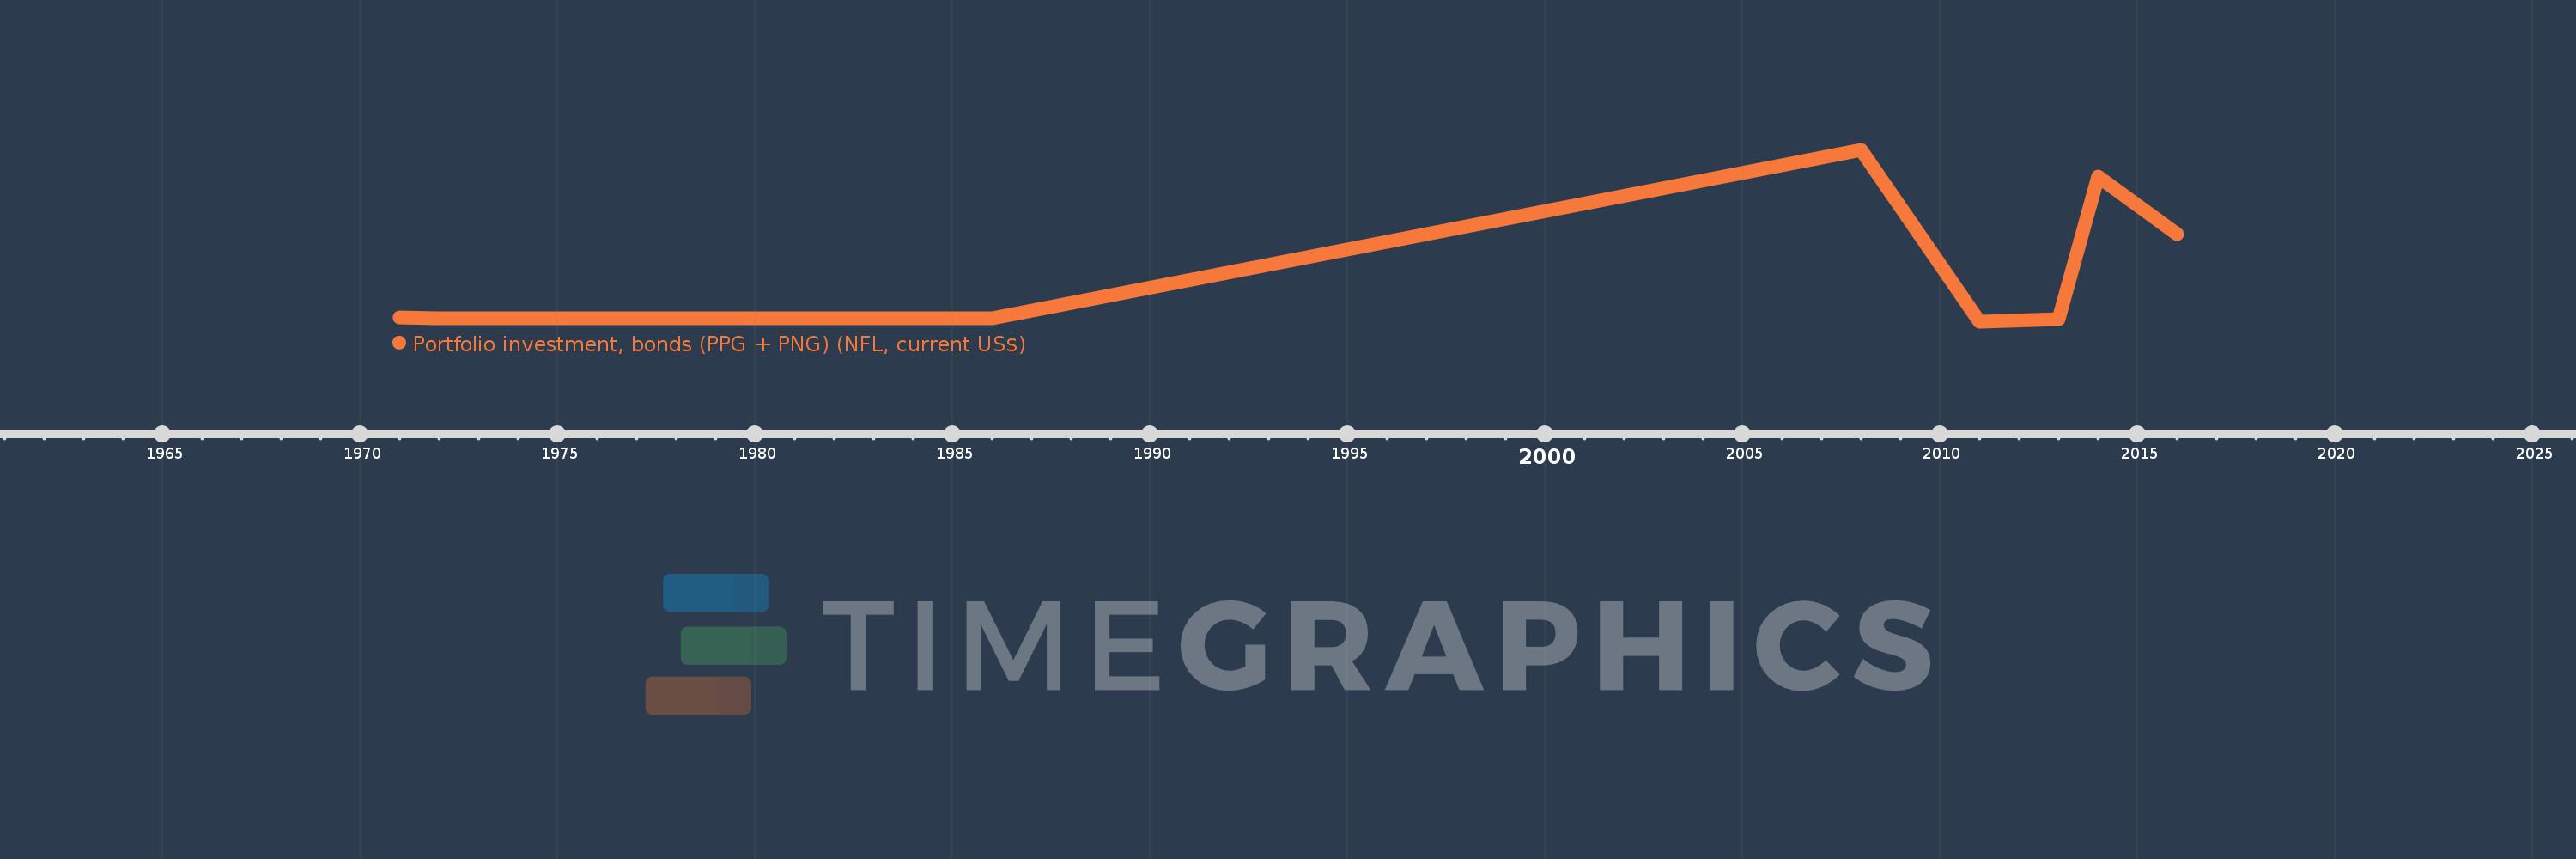
Gabon
GAB
true
2
1
Portfolio investment, bonds (PPG + PNG) (NFL, current US$)
2016,2014,2013,2011,2008,1986,1985,1984,1983,1982,1981,1980,1979,1978,1977,1976,1975,1974,1973,1972,1971