33
/
AIzaSyB4mHJ5NPEv-XzF7P6NDYXjlkCWaeKw5bc
November 30, 2025
143395
Grenada
GRD
true
2
1
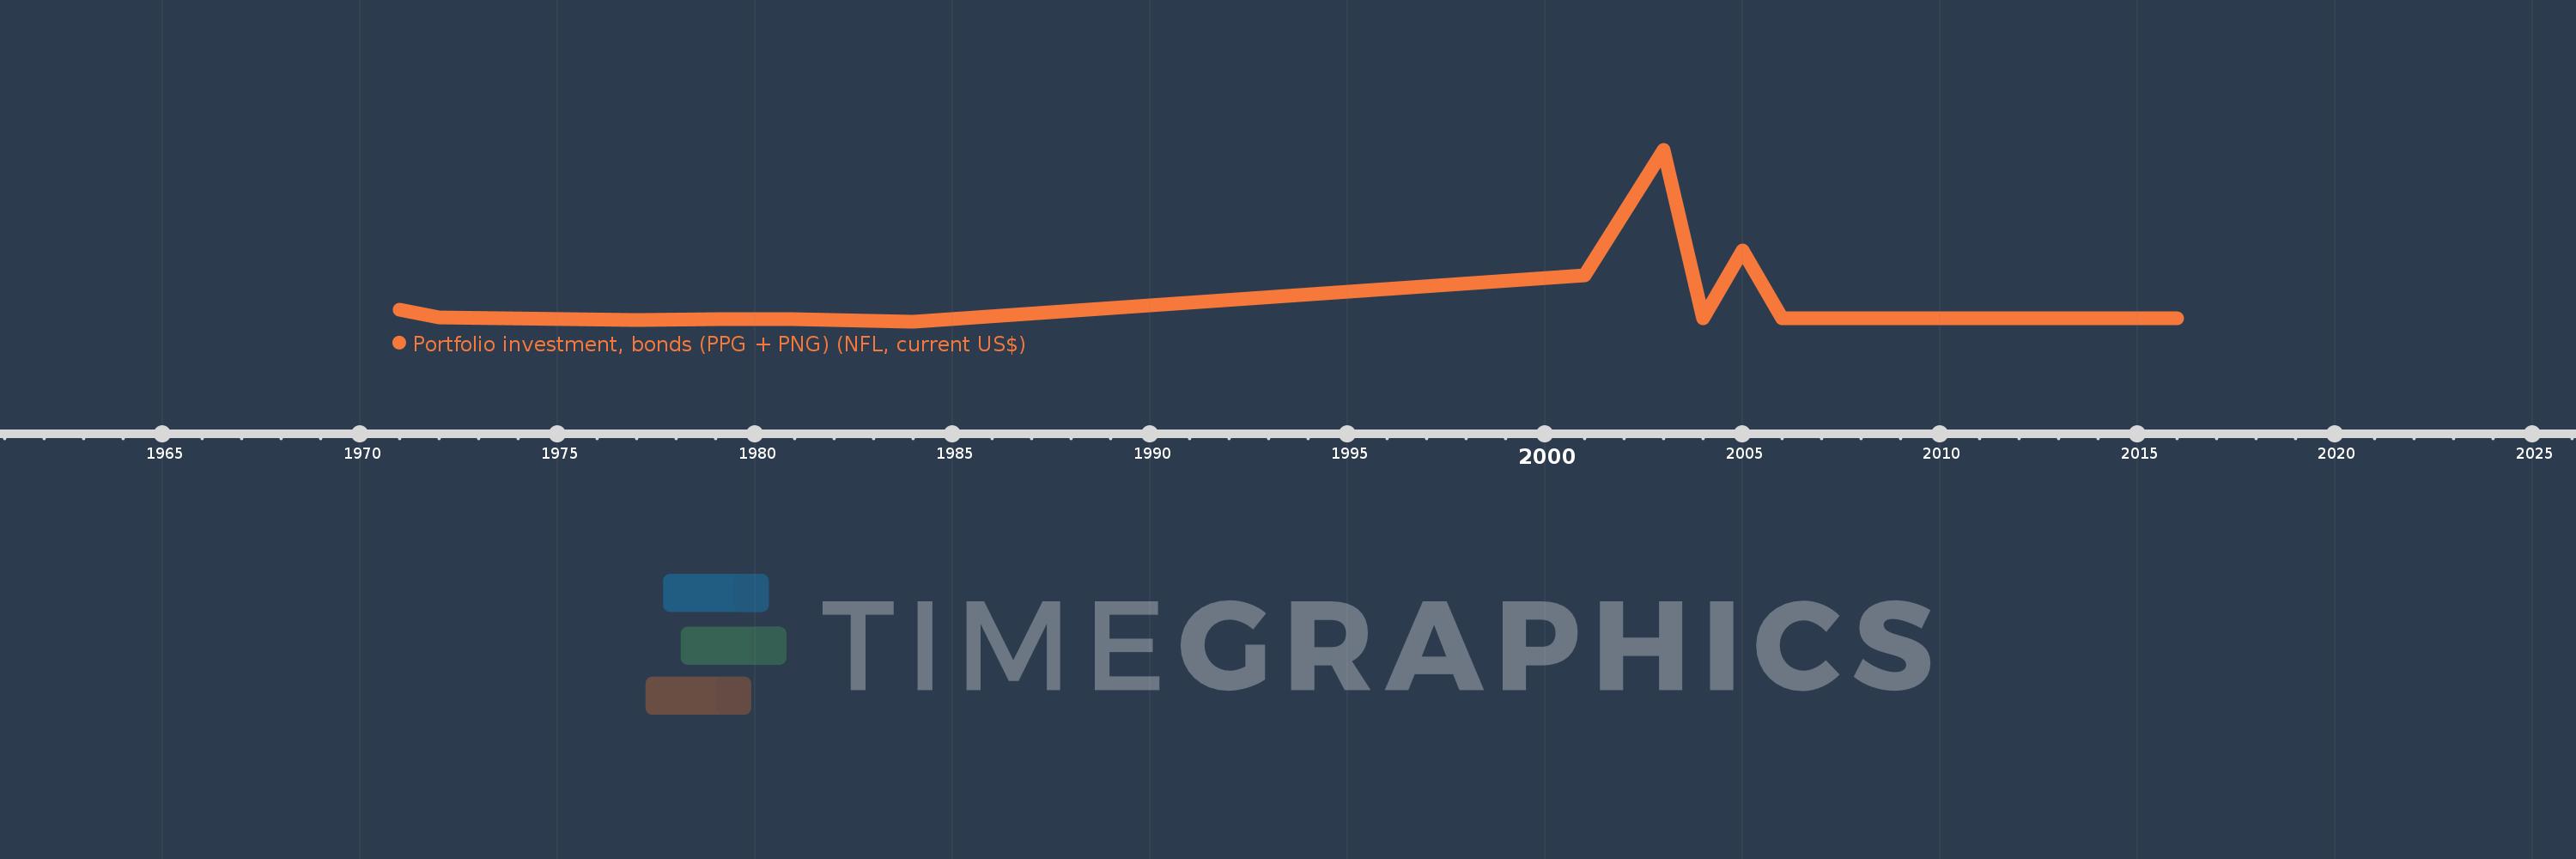
Portfolio investment, bonds (PPG + PNG) (NFL, current US$)
2016,2015,2014,2013,2012,2011,2010,2009,2008,2007,2006,2005,2004,2003,2001,1984,1981,1979,1977,1972,1971