33
/
AIzaSyAYiBZKx7MnpbEhh9jyipgxe19OcubqV5w
August 1, 2025
60045
Sub-Saharan Africa (excluding high income)
SSA
false
2
1
Net acquisition of financial assets (% of GDP)
2013,2012,2011,2010,2009,2007,2006,2005,2004
Download
Global statistics library →Sub-Saharan Africa (excluding high income) →

Net acquisition of financial assets (% of GDP)

This statistics in other country:

AfghanistanAlbaniaAlgeriaAngolaAntigua and BarbudaArmeniaAustraliaAustriaAzerbaijanBahrainBangladeshBarbadosBelarusBelgiumBelizeBeninBhutanBoliviaBosnia and HerzegovinaBrazilBurkina FasoBurundiCabo VerdeCambodiaCanadaCaribbean small statesCentral African RepublicCentral Europe and the BalticsChileColombiaCongo, Dem. Rep.Congo, Rep.Cote d'IvoireCroatiaCyprusCzech RepublicDominicaDominican RepublicEgypt, Arab Rep.El SalvadorEquatorial GuineaEstoniaEthiopiaEuro areaEurope & Central Asia (excluding high income)Europe & Central Asia (IDA & IBRD countries)European UnionFijiFinlandFranceGeorgiaGermanyGhanaGuatemalaHigh incomeHondurasHong Kong SAR, ChinaHungaryIcelandIndiaIndonesiaIran, Islamic Rep.IraqIrelandIsraelItalyJamaicaJapanJordanKazakhstanKiribatiKorea, Rep.Kyrgyz RepublicLao PDRLebanonLesothoLithuaniaLow incomeLower middle incomeLuxembourgMacao SAR, ChinaMacedonia, FYRMadagascarMalawiMalaysiaMaldivesMaliMaltaMauritiusMicronesia, Fed. Sts.Middle East & North Africa (excluding high income)Middle East & North Africa (IDA & IBRD countries)MoldovaMongoliaMoroccoMozambiqueNamibiaNepalNetherlandsNew ZealandNigeriaNorth AmericaNorwayOECD membersOmanPacific island small statesParaguayPeruPhilippinesPolandPortugalPost-demographic dividendRomaniaRussian FederationRwandaSamoaSan MarinoSao Tome and PrincipeSenegalSerbiaSeychellesSingaporeSlovak RepublicSolomon IslandsSouth AfricaSouth AsiaSouth Asia (IDA & IBRD)SpainSri LankaSt. Kitts and NevisSub-Saharan Africa Sub-Saharan Africa (excluding high income)Sub-Saharan Africa (IDA & IBRD countries)SurinameSwazilandSwitzerlandSyrian Arab RepublicTanzaniaThailandTimor-LesteTogoTrinidad and TobagoTurkeyUgandaUkraineUnited Arab EmiratesUnited KingdomUnited StatesUruguayVanuatuVietnamWest Bank and GazaZimbabwe

Timeline:

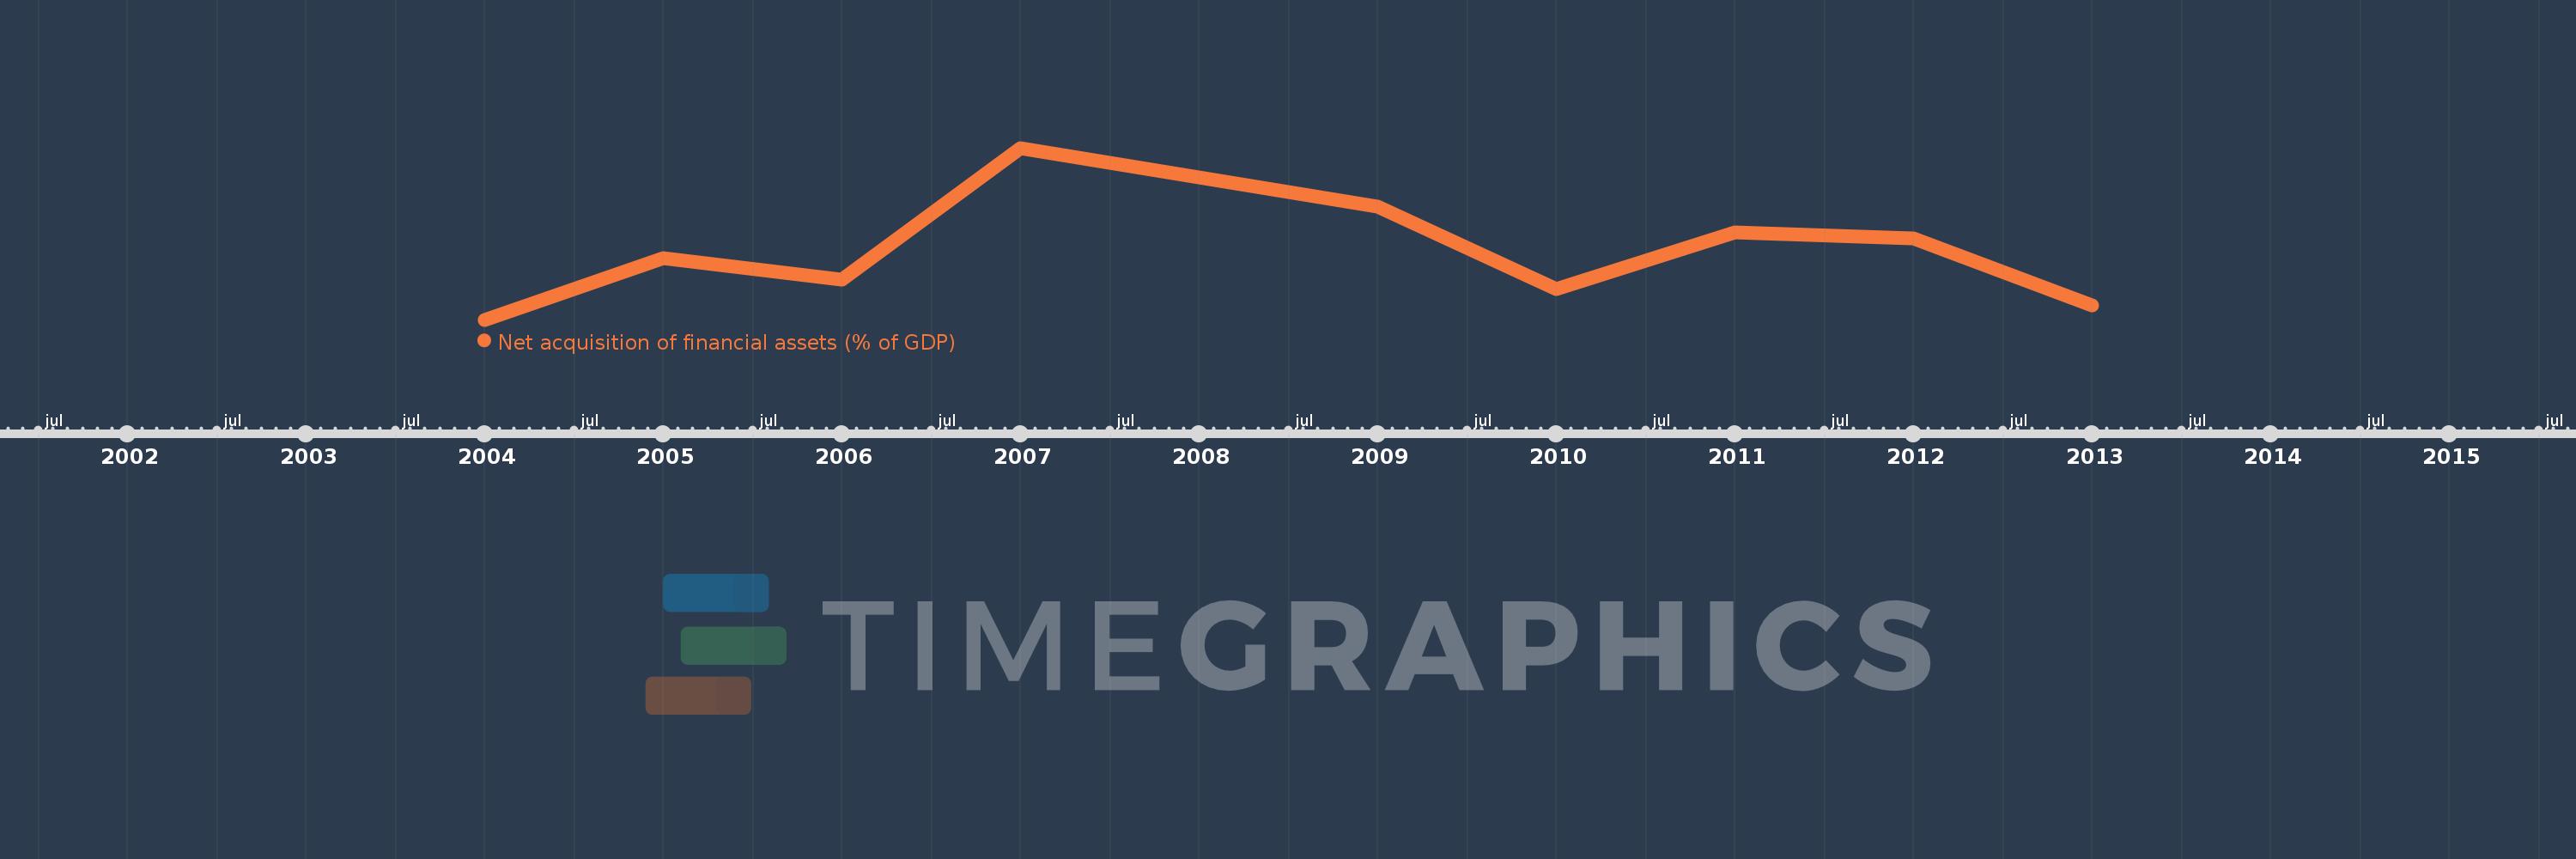
This timeline shows a graph from 2004 to 2013 of Sub-Saharan Africa (excluding high income). No data until 2003. Number of actual observations by date: 9.

Source name:

World Development Indicators

Source organization:

International Monetary Fund, Government Finance Statistics Yearbook and data files.

Categories, topics:

Public Sector

Last updated:

apr 23, 2017

Indicators value changes by year

Meaning:
1.576
Minimum:
0.356
jan 1, 2004
Maximum:
3.498
jan 1, 2007
At the date of observation
Value
Absolute change
Change from the previous value
jan 1, 2004
0.356
+0.356
0.0%
jan 1, 2005
1.485
+1.129
317.55%
jan 1, 2006
1.092
-0.393
-26.48%
jan 1, 2007
3.498
+2.406
220.44%
jan 1, 2009
2.422
-1.077
-30.78%
jan 1, 2010
0.91
-1.511
-62.4%
jan 1, 2011
1.957
+1.047
115.0%
jan 1, 2012
1.846
-0.111
-5.69%
jan 1, 2013
0.615
-1.231
-66.67%

Ranking of countries by current statistics by years