Download This statistics in other country:
Timeline:
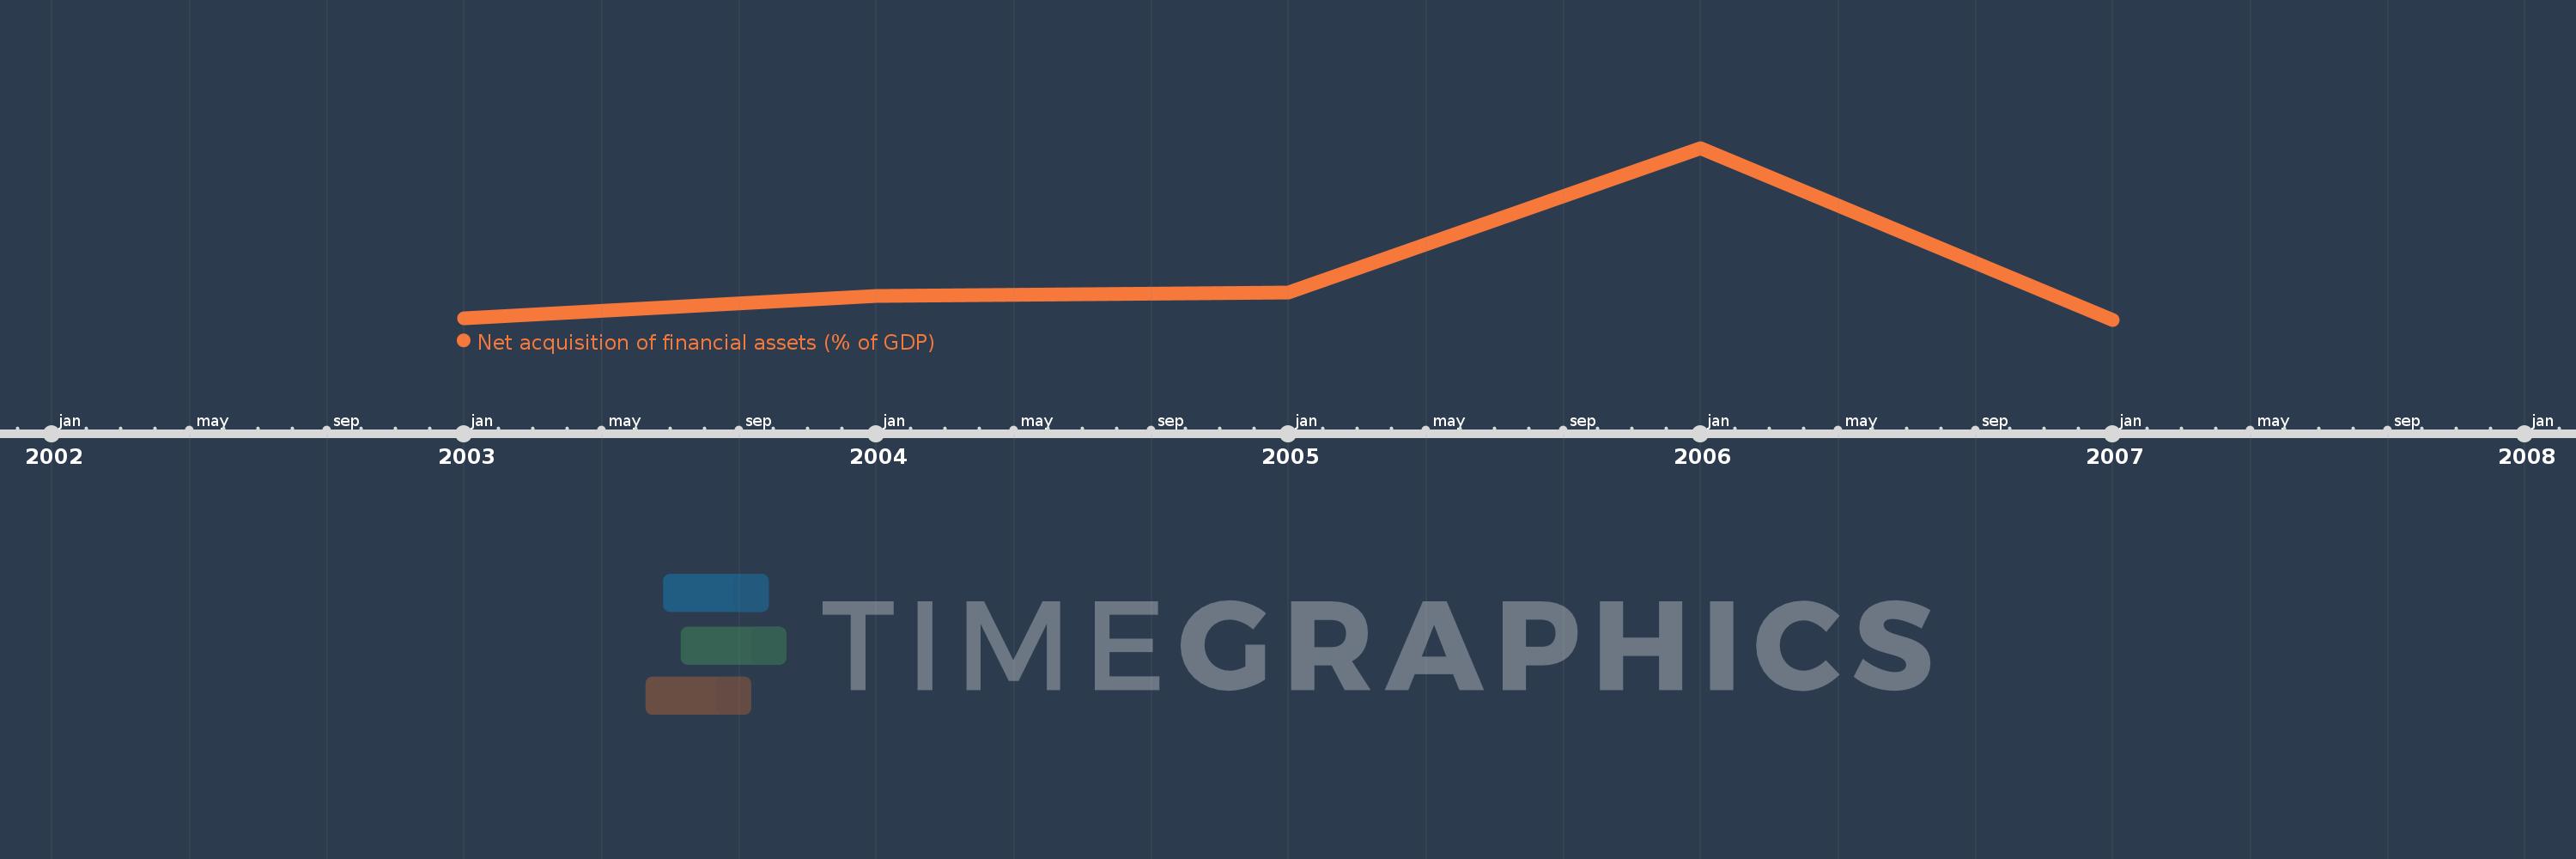
This timeline shows a graph from 2003 to 2007 of Middle East & North Africa (excluding high income). No data until 2002. Number of actual observations by date: 5.
Source name:
World Development Indicators
Source organization:
International Monetary Fund, Government Finance Statistics Yearbook and data files.
Categories, topics:
Public Sector
Last updated:
apr 23, 2017
Indicators value changes by year
At the date of observation
Value
Absolute change
Change from the previous value
jan 1, 2003
3.169
+3.169
0.0%
jan 1, 2004
3.486
+0.317
10.02%
jan 1, 2005
3.54
+0.053
1.53%
jan 1, 2006
5.578
+2.038
57.59%
jan 1, 2007
3.149
-2.429
-43.54%
Ranking of countries by current statistics by years