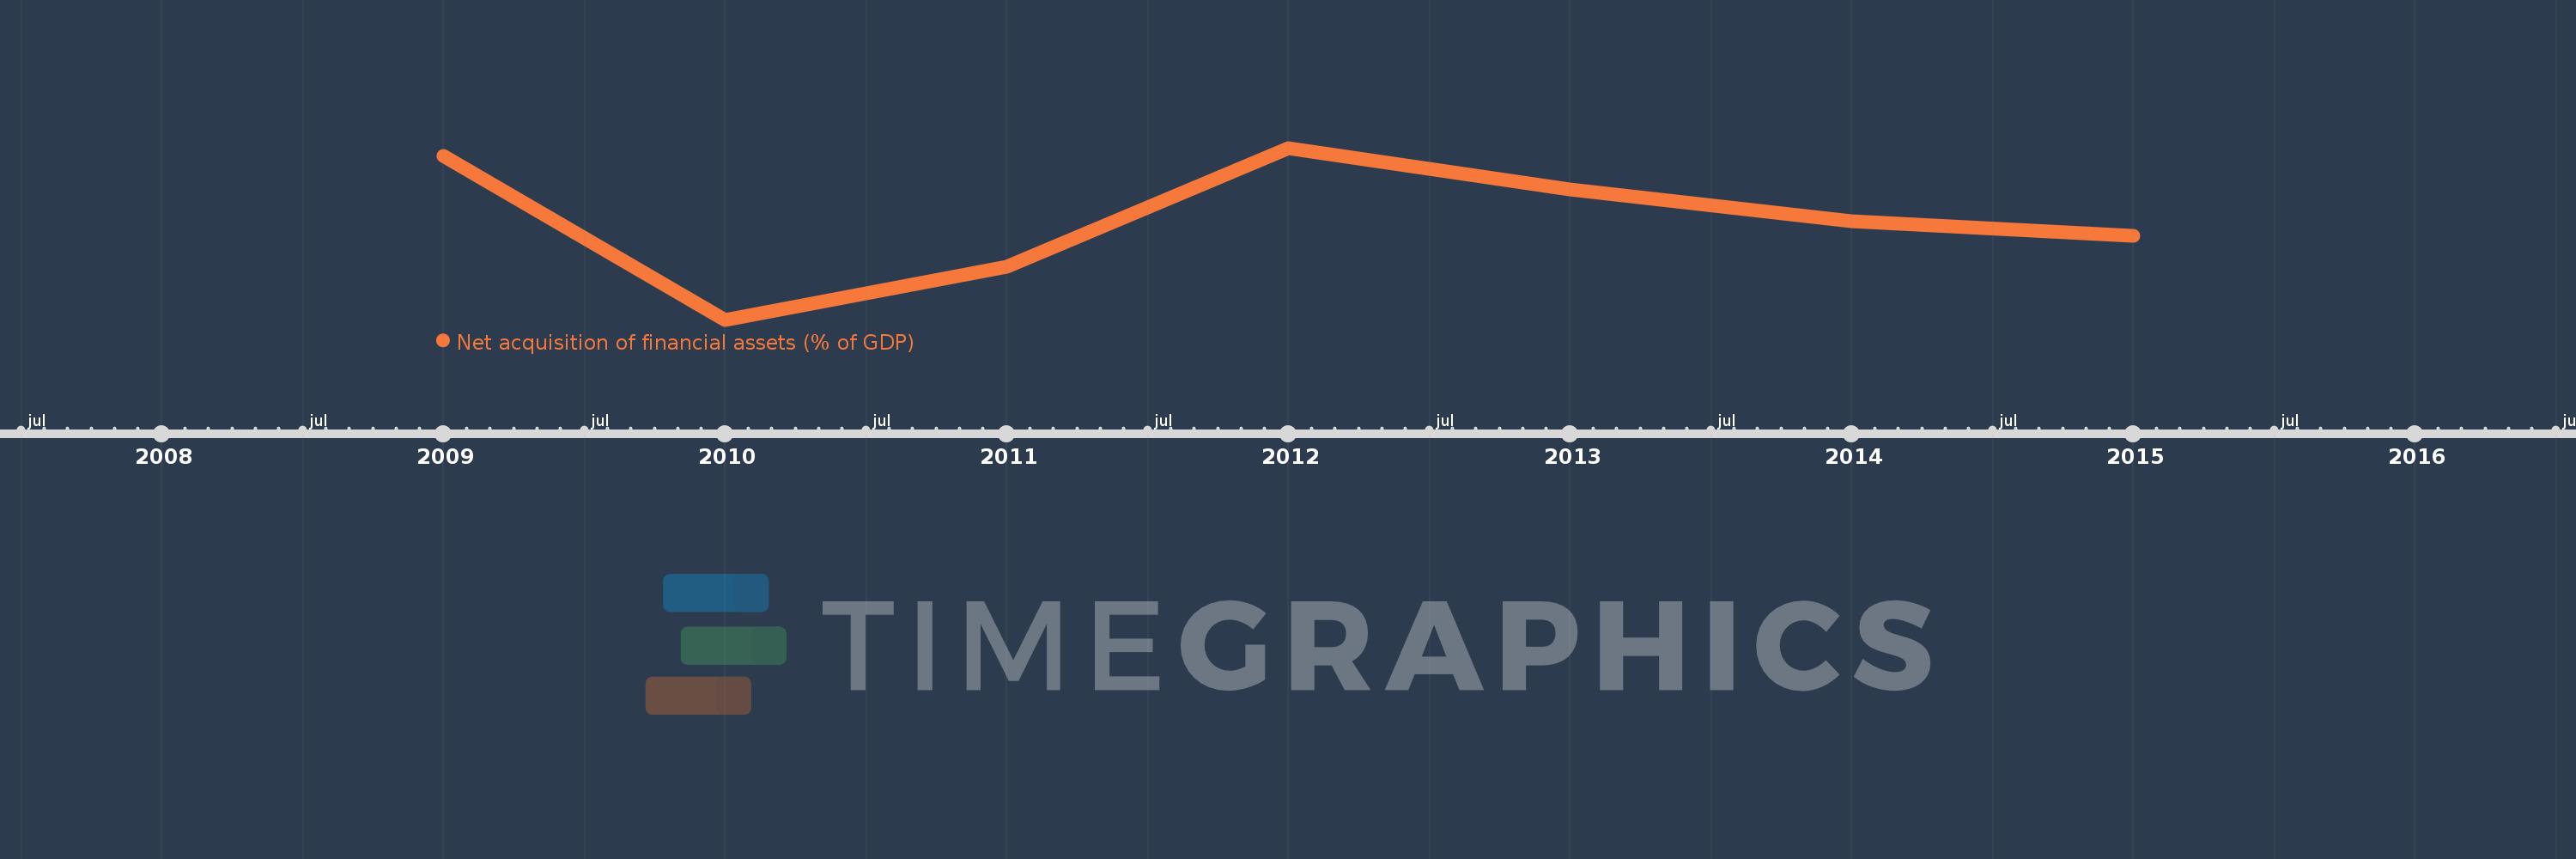
This timeline shows a graph from 2009 to 2015 of Europe & Central Asia (excluding high income). No data until 2008. Number of actual observations by date: 7.
Source name:
World Development Indicators
Source organization:
International Monetary Fund, Government Finance Statistics Yearbook and data files.
Categories, topics:
Public Sector
Last updated:
apr 23, 2017
Indicators value changes by year
Meaning:
2.014
Minimum:
-0.703
jan 1, 2010
Maximum:
3.959
jan 1, 2012
At the date of observation
Value
Absolute change
Change from the previous value
jan 1, 2009
3.734
+3.734
0.0%
jan 1, 2010
-0.703
-4.437
-118.83%
jan 1, 2011
0.734
+1.438
-204.43%
jan 1, 2012
3.959
+3.224
439.06%
jan 1, 2013
2.835
-1.123
-28.38%
jan 1, 2014
1.968
-0.867
-30.59%
jan 1, 2015
1.569
-0.399
-20.29%
Ranking of countries by current statistics by years