Download This statistics in other country:
Timeline:
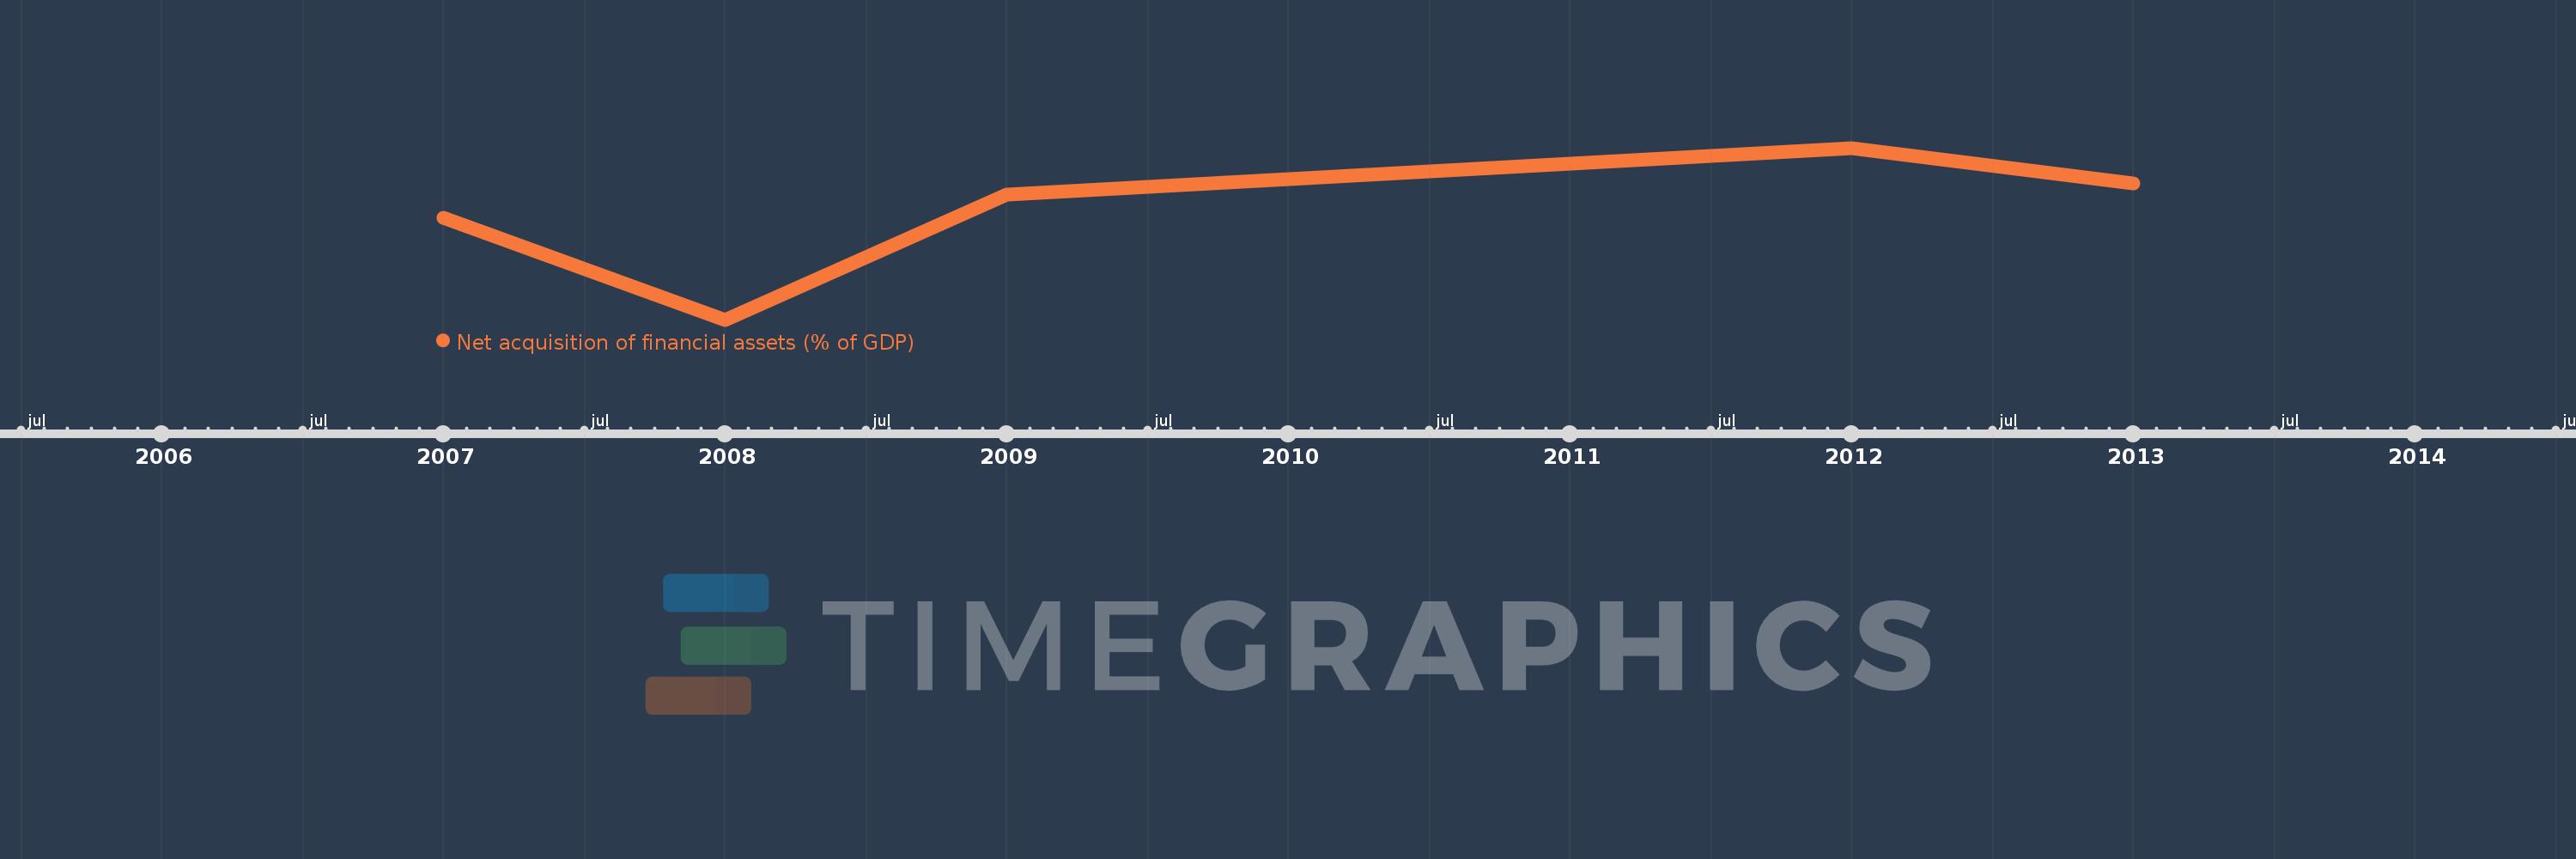
This timeline shows a graph from 2007 to 2013 of Congo, Rep.. No data until 2006. Number of actual observations by date: 5.
Source name:
World Development Indicators
Source organization:
International Monetary Fund, Government Finance Statistics Yearbook and data files.
Categories, topics:
Public Sector
Last updated:
apr 23, 2017
Indicators value changes by year
Maximum:
17.655
jan 1, 2012
At the date of observation
Value
Absolute change
Change from the previous value
jan 1, 2007
11.045
+11.045
0.0%
jan 1, 2008
1.342
-9.703
-87.85%
jan 1, 2009
13.22
+11.878
885.29%
jan 1, 2012
17.655
+4.436
33.55%
jan 1, 2013
14.308
-3.347
-18.96%
Ranking of countries by current statistics by years