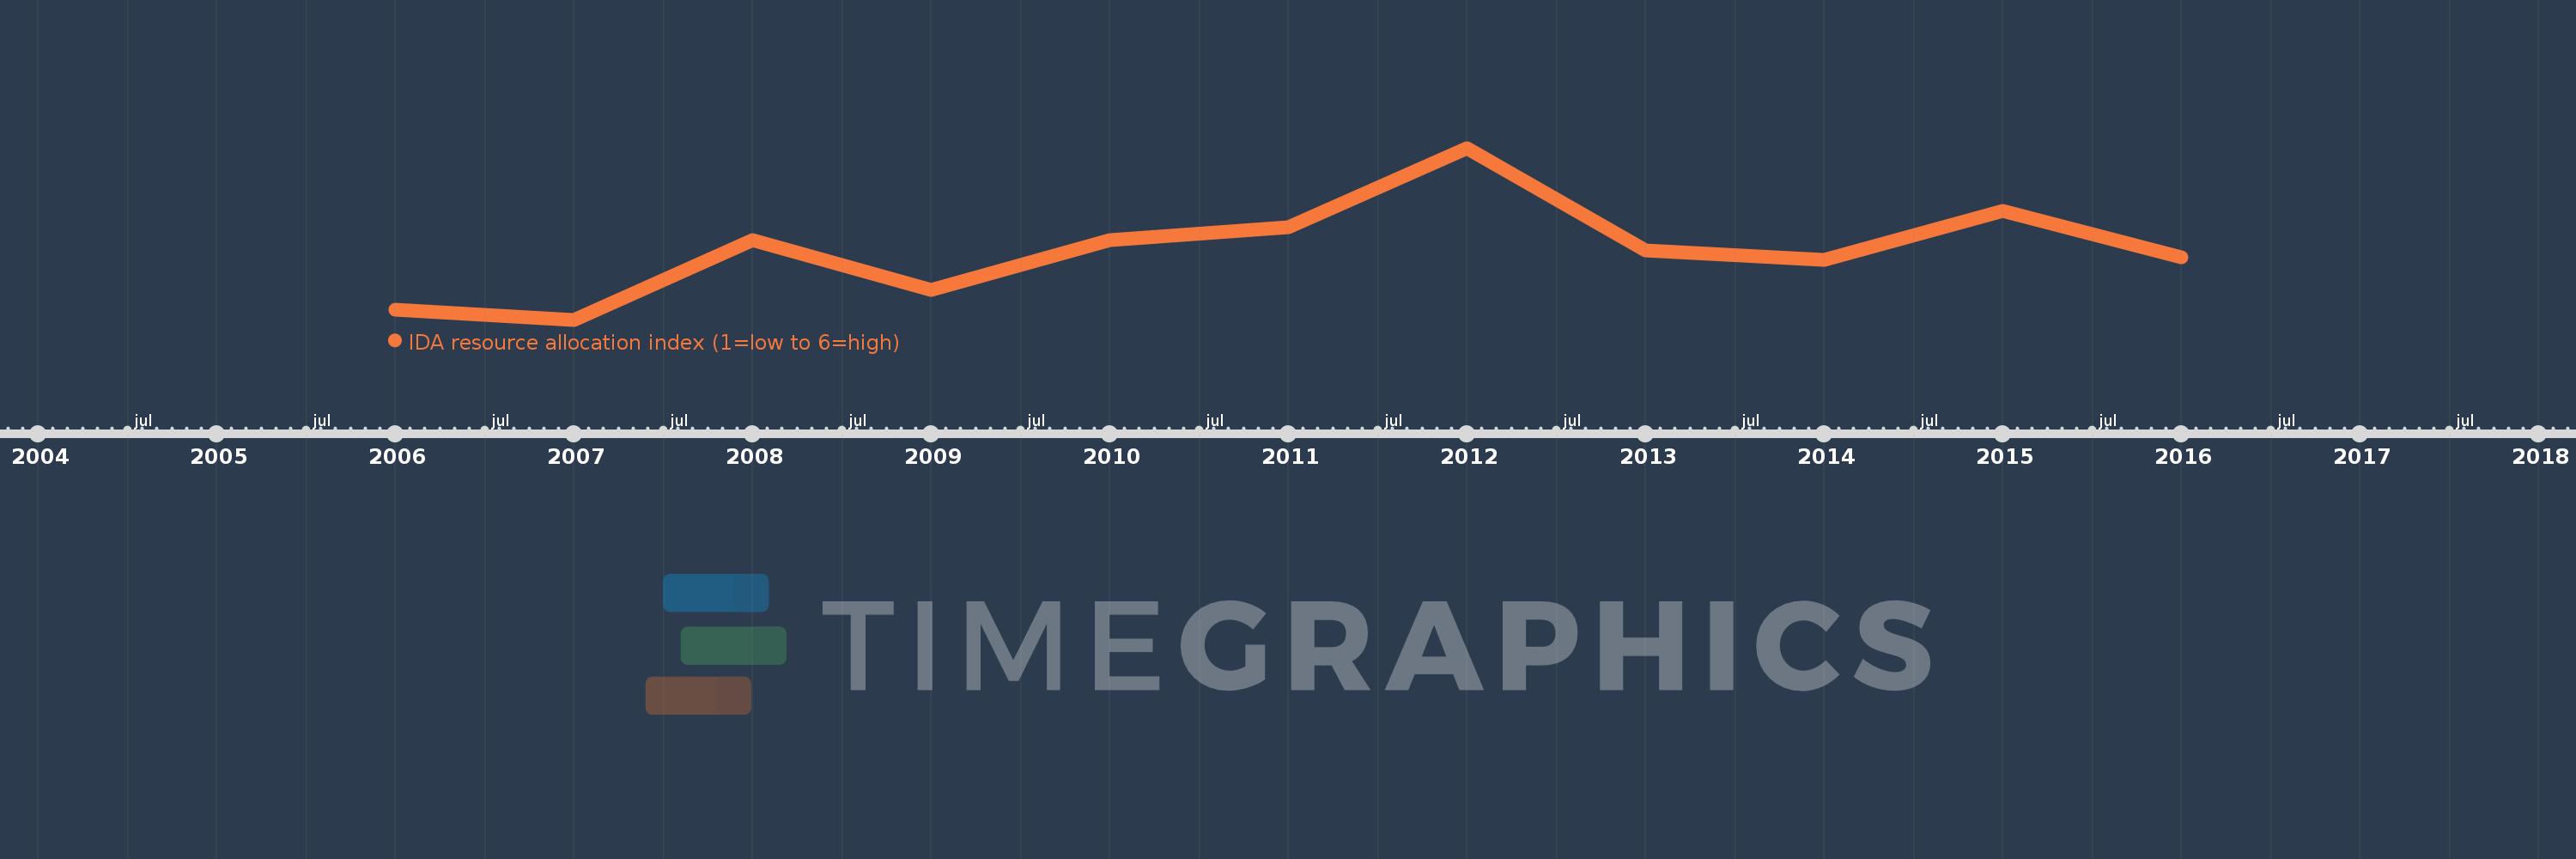
This timeline shows a graph from 2006 to 2016 of Sub-Saharan Africa (excluding high income). No data until 2005. Number of actual observations by date: 11.
Source name:
World Development Indicators
Source organization:
World Bank Group, CPIA database (http://www.worldbank.org/ida).
Categories, topics:
Public Sector
Last updated:
apr 23, 2017
Indicators value changes by year
Meaning:
3.174
Minimum:
3.153
jan 1, 2007
Maximum:
3.205
jan 1, 2012
At the date of observation
Value
Absolute change
Change from the previous value
jan 1, 2006
3.156
+3.156
0.0%
jan 1, 2007
3.153
-0.002
-0.07%
jan 1, 2008
3.177
+0.024
0.76%
jan 1, 2009
3.162
-0.015
-0.47%
jan 1, 2010
3.177
+0.015
0.46%
jan 1, 2011
3.181
+0.004
0.13%
jan 1, 2012
3.205
+0.024
0.74%
jan 1, 2013
3.174
-0.031
-0.96%
jan 1, 2014
3.171
-0.003
-0.09%
jan 1, 2015
3.186
+0.015
0.49%
jan 1, 2016
3.172
-0.014
-0.45%
Ranking of countries by current statistics by years