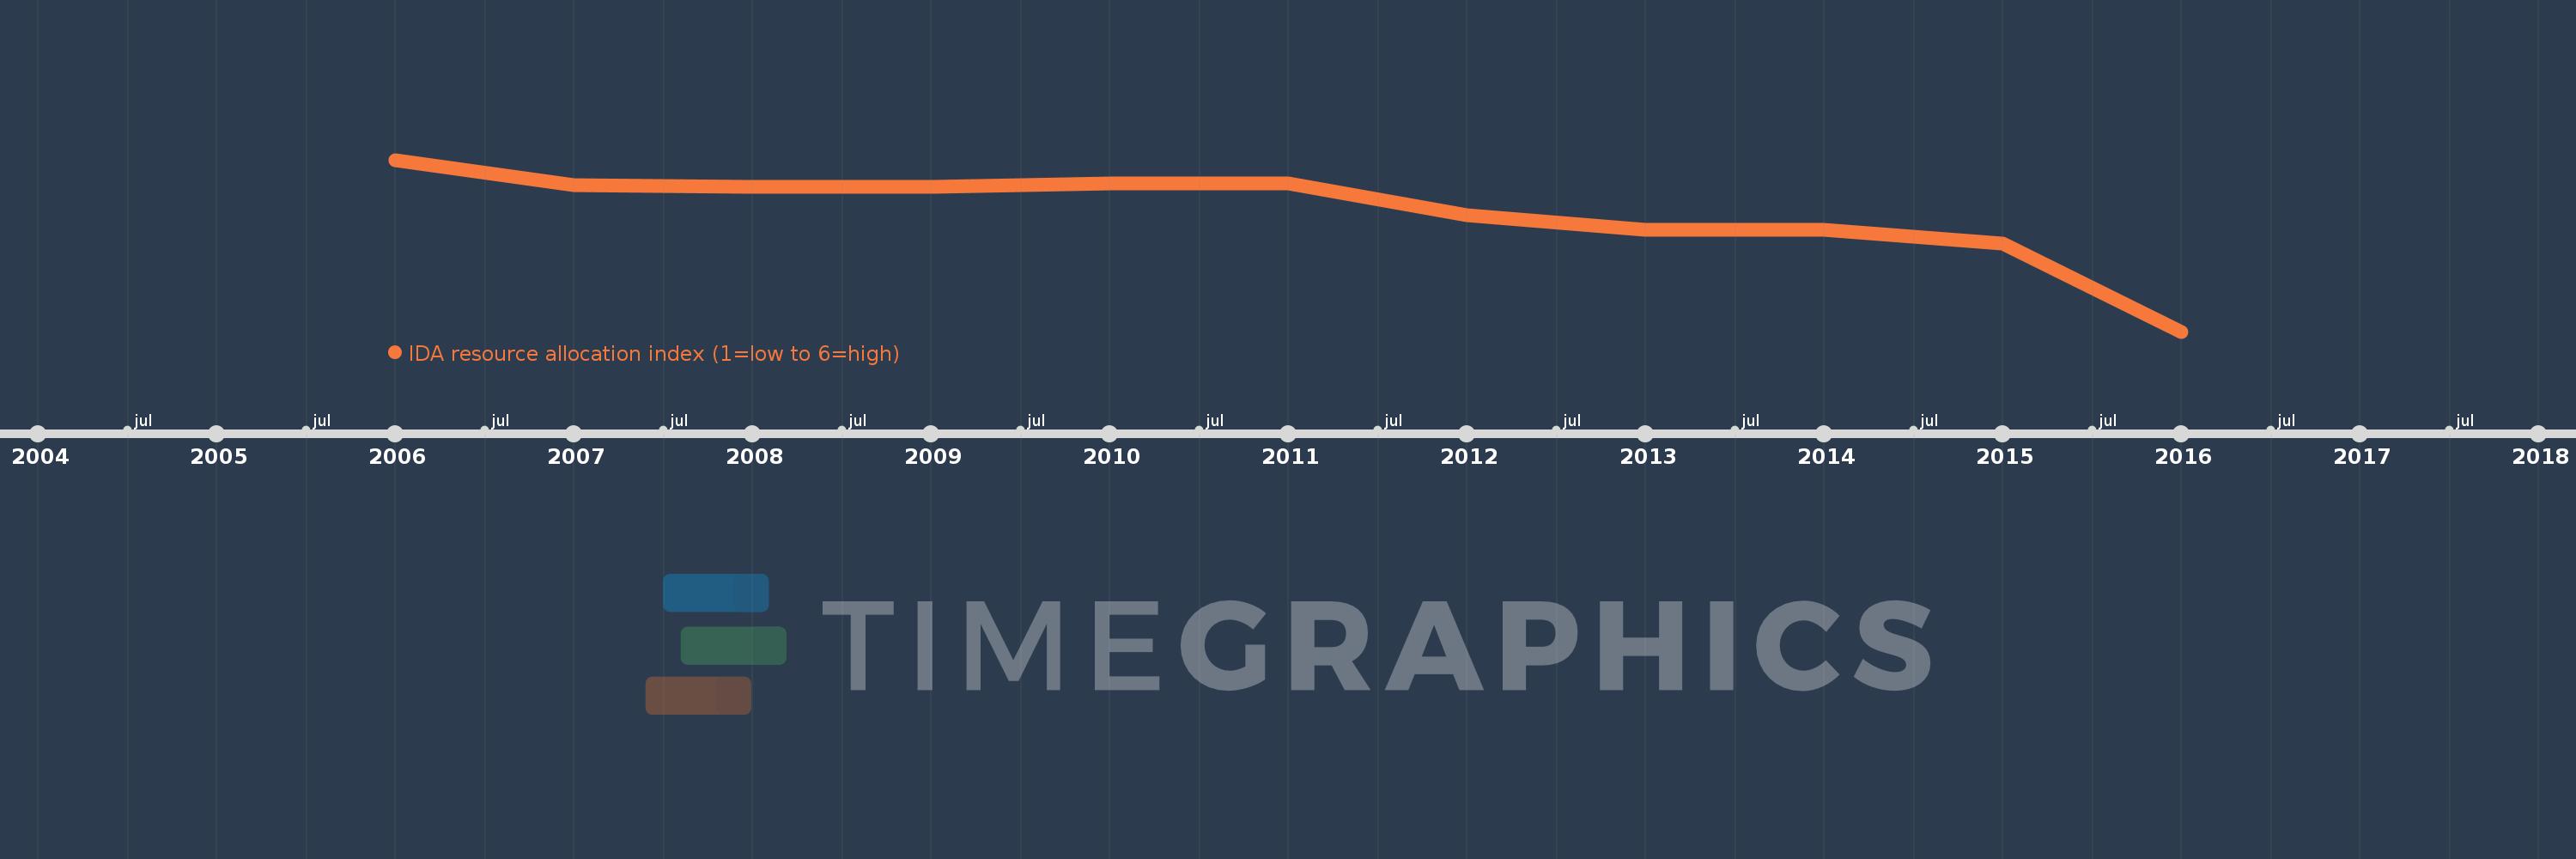
This timeline shows a graph from 2006 to 2016 of Middle East & North Africa (excluding high income). No data until 2005. Number of actual observations by date: 11.
Source name:
World Development Indicators
Source organization:
World Bank Group, CPIA database (http://www.worldbank.org/ida).
Categories, topics:
Public Sector
Last updated:
apr 23, 2017
Indicators value changes by year
Meaning:
3.086
Minimum:
2.788
jan 1, 2016
Maximum:
3.217
jan 1, 2006
At the date of observation
Value
Absolute change
Change from the previous value
jan 1, 2006
3.217
+3.217
0.0%
jan 1, 2007
3.154
-0.063
-1.94%
jan 1, 2008
3.15
-0.004
-0.13%
jan 1, 2009
3.15
0.0
0.0%
jan 1, 2010
3.158
+0.008
0.26%
jan 1, 2011
3.158
0.0
0.0%
jan 1, 2012
3.079
-0.079
-2.51%
jan 1, 2013
3.042
-0.038
-1.22%
jan 1, 2014
3.042
0.0
0.0%
jan 1, 2015
3.008
-0.033
-1.1%
jan 1, 2016
2.788
-0.221
-7.34%
Ranking of countries by current statistics by years