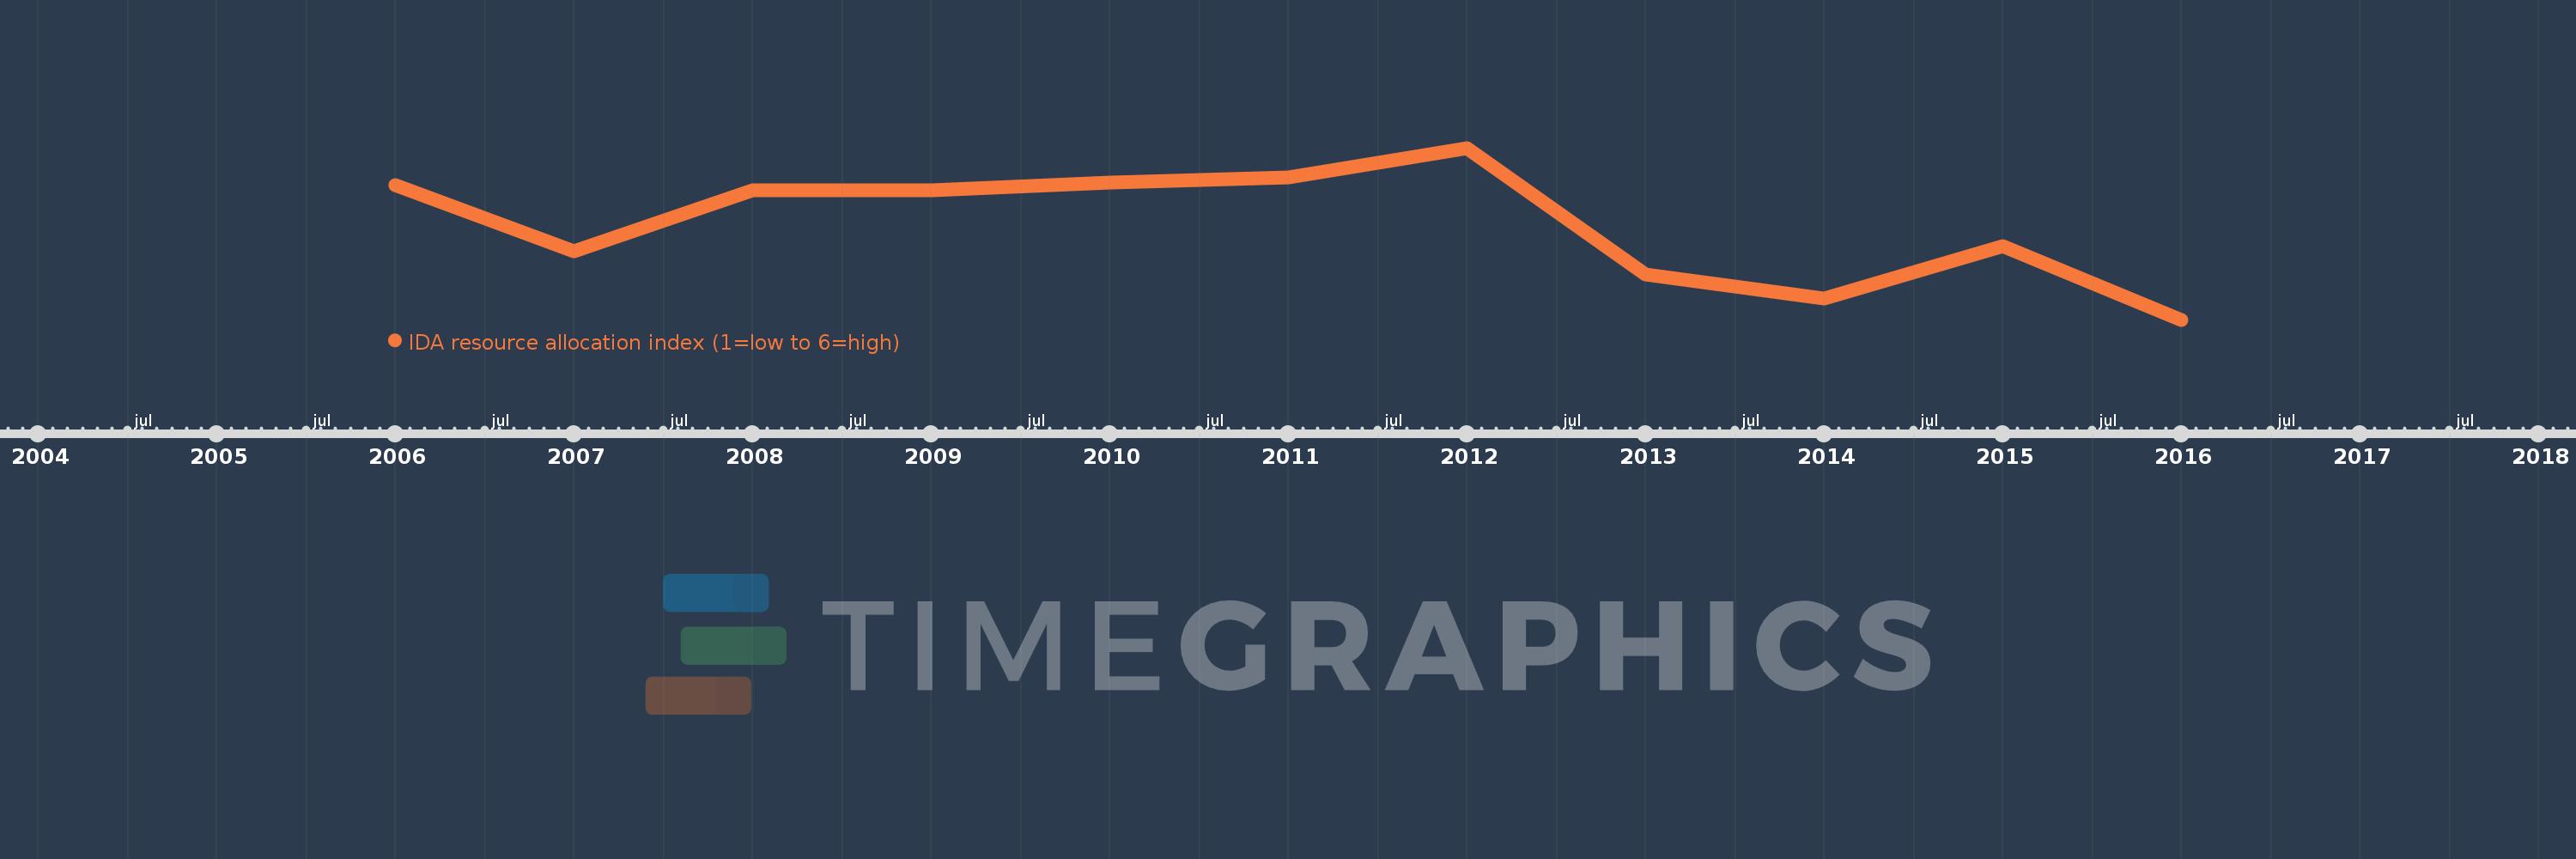
This timeline shows a graph from 2006 to 2016 of Least developed countries: UN classification. No data until 2005. Number of actual observations by date: 11.
Source name:
World Development Indicators
Source organization:
World Bank Group, CPIA database (http://www.worldbank.org/ida).
Categories, topics:
Public Sector
Last updated:
apr 23, 2017
Indicators value changes by year
Meaning:
3.151
Minimum:
3.115
jan 1, 2016
Maximum:
3.18
jan 1, 2012
At the date of observation
Value
Absolute change
Change from the previous value
jan 1, 2006
3.166
+3.166
0.0%
jan 1, 2007
3.141
-0.025
-0.79%
jan 1, 2008
3.164
+0.024
0.75%
jan 1, 2009
3.164
0.0
-0.01%
jan 1, 2010
3.167
+0.003
0.09%
jan 1, 2011
3.169
+0.002
0.07%
jan 1, 2012
3.18
+0.011
0.34%
jan 1, 2013
3.132
-0.048
-1.5%
jan 1, 2014
3.123
-0.01
-0.31%
jan 1, 2015
3.143
+0.02
0.64%
jan 1, 2016
3.115
-0.028
-0.9%
Ranking of countries by current statistics by years