33
/
AIzaSyB4mHJ5NPEv-XzF7P6NDYXjlkCWaeKw5bc
November 30, 2025
26593
Early-demographic dividend
EAR
false
2
1
IDA resource allocation index (1=low to 6=high)
2016,2015,2014,2013,2012,2011,2010,2009,2008,2007,2006
Create a timeline
Public Timelines
For education
For educational institutions
For teachers
For students
Cabinet
For educational institutions
For teachers
For students
Open cabinet
FAQ
Close
Create a timeline
Public timelines
FAQ
About & Feedback
Terms
Privacy
FAQ
Support 24/7
Cabinet
Get premium
Donate
Download
Global statistics library
→
Early-demographic dividend
→
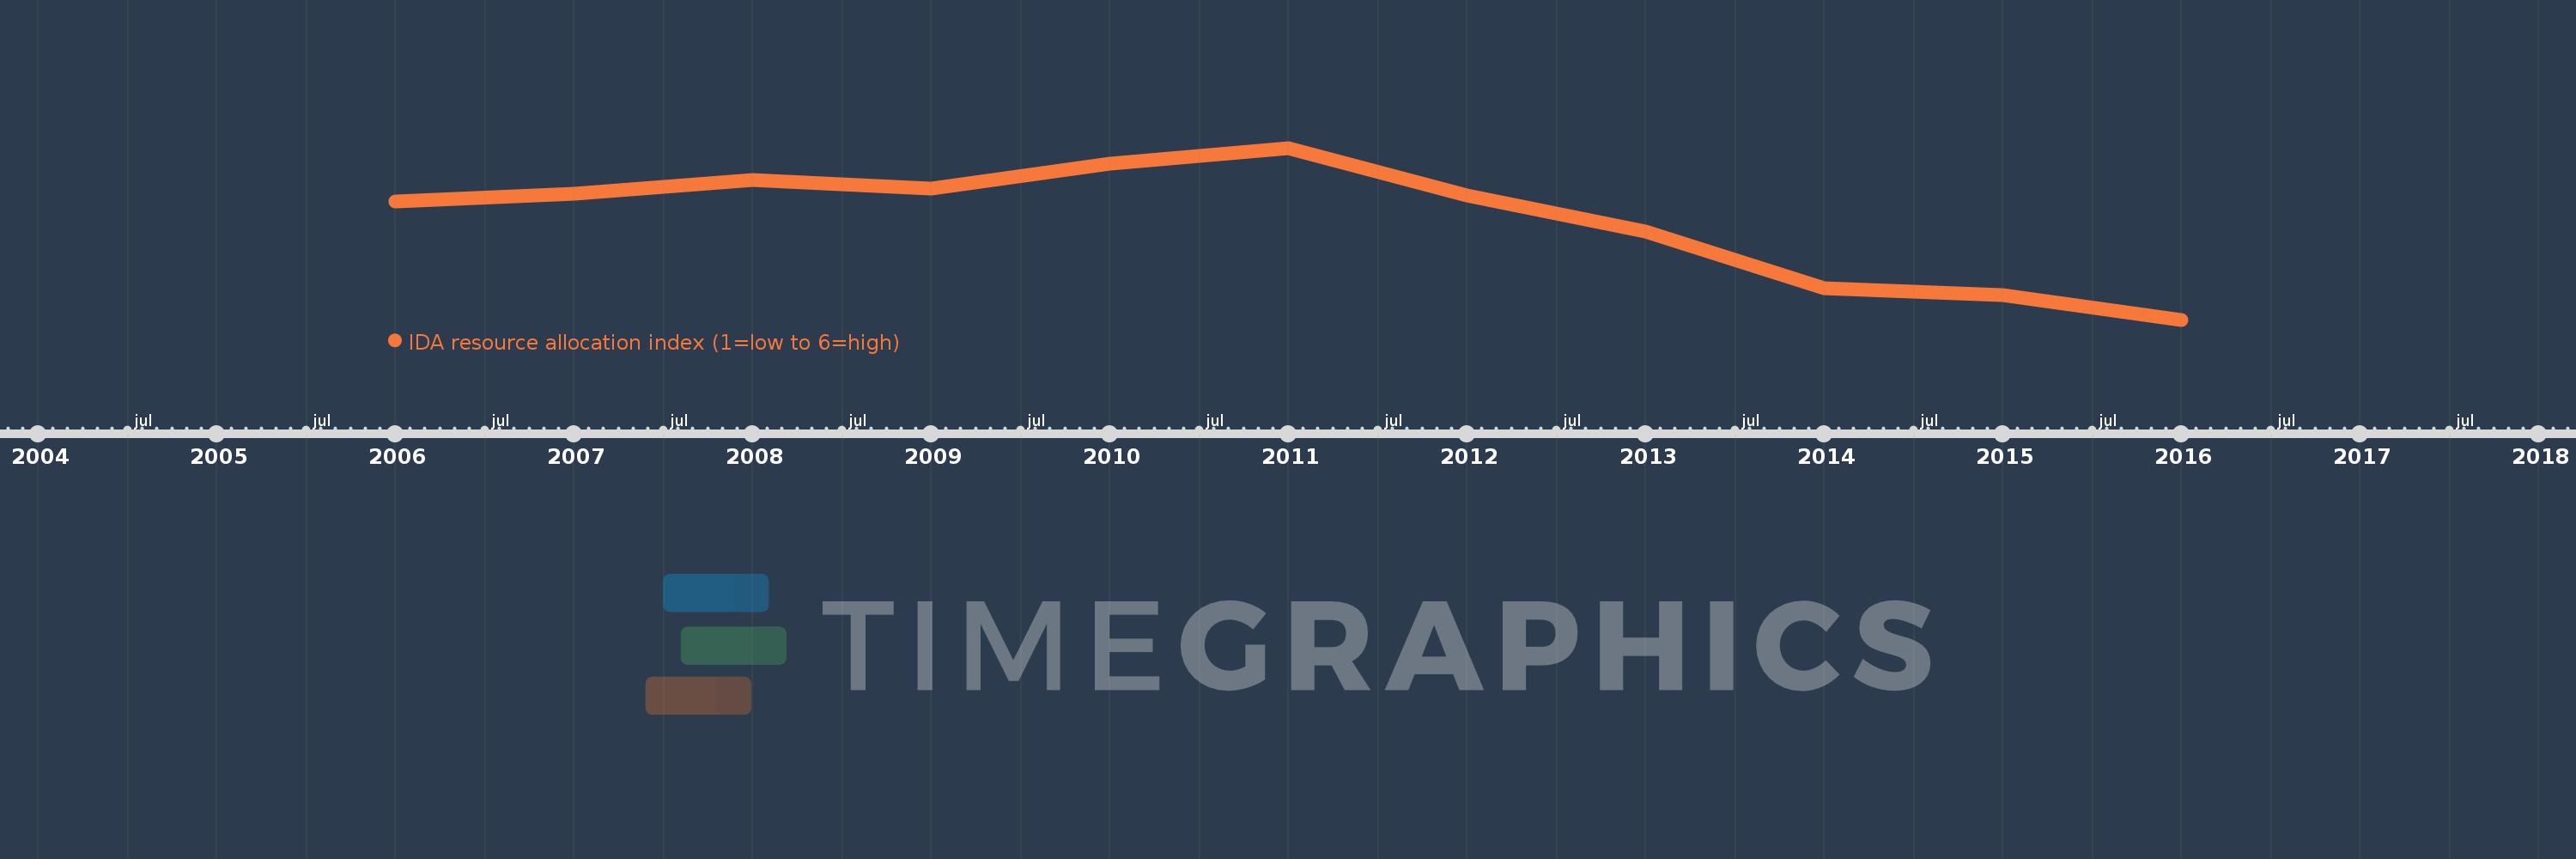
IDA resource allocation index (1=low to 6=high)
This statistics in other country:
Afghanistan
Albania
Angola
Arab World
Armenia
Azerbaijan
Bangladesh
Benin
Bhutan
Bolivia
Bosnia and Herzegovina
Burkina Faso
Burundi
Cabo Verde
Cambodia
Cameroon
Caribbean small states
Central African Republic
Chad
Comoros
Congo, Dem. Rep.
Congo, Rep.
Cote d'Ivoire
Djibouti
Dominica
Early-demographic dividend
East Asia & Pacific
East Asia & Pacific (excluding high income)
East Asia & Pacific (IDA & IBRD countries)
Eritrea
Ethiopia
Europe & Central Asia
Europe & Central Asia (excluding high income)
Europe & Central Asia (IDA & IBRD countries)
Fragile and conflict affected situations
Gambia, The
Georgia
Ghana
Grenada
Guinea
Guinea-Bissau
Guyana
Haiti
Heavily indebted poor countries (HIPC)
Honduras
IBRD only
IDA & IBRD total
IDA blend
IDA only
IDA total
India
Indonesia
Kenya
Kiribati
Kosovo
Kyrgyz Republic
Lao PDR
Late-demographic dividend
Latin America & Caribbean
Latin America & Caribbean (excluding high income)
Latin America & the Caribbean (IDA & IBRD countries)
Least developed countries: UN classification
Lesotho
Liberia
Low & middle income
Low income
Lower middle income
Madagascar
Malawi
Maldives
Mali
Marshall Islands
Mauritania
Micronesia, Fed. Sts.
Middle East & North Africa
Middle East & North Africa (excluding high income)
Middle East & North Africa (IDA & IBRD countries)
Middle income
Moldova
Mongolia
Mozambique
Myanmar
Nepal
Nicaragua
Niger
Nigeria
Other small states
Pacific island small states
Pakistan
Papua New Guinea
Post-demographic dividend
Pre-demographic dividend
Rwanda
Samoa
Sao Tome and Principe
Senegal
Serbia
Sierra Leone
Small states
Solomon Islands
South Asia
South Asia (IDA & IBRD)
South Sudan
Sri Lanka
St. Lucia
St. Vincent and the Grenadines
Sub-Saharan Africa
Sub-Saharan Africa (excluding high income)
Sub-Saharan Africa (IDA & IBRD countries)
Sudan
Tajikistan
Tanzania
Timor-Leste
Togo
Tonga
Tuvalu
Uganda
Upper middle income
Uzbekistan
Vanuatu
Vietnam
World
Yemen, Rep.
Zambia
Zimbabwe
Timeline:
This timeline shows a graph from
2006
to
2016
of Early-demographic dividend. No data until
2005
. Number of actual observations by date:
11
.
Source name:
World Development Indicators
Source organization:
World Bank Group, CPIA database (http://www.worldbank.org/ida).
Categories, topics:
Public Sector
Last updated:
apr 23, 2017
Indicators value changes by year
Meaning:
3.369
Minimum:
3.312
jan 1, 2016
Maximum:
3.409
jan 1, 2011
At the date of observation
Value
Absolute change
Change from the previous value
jan 1, 2006
3.379
+3.379
0.0%
jan 1, 2007
3.383
+0.004
0.13%
jan 1, 2008
3.391
+0.007
0.21%
jan 1, 2009
3.386
-0.004
-0.13%
jan 1, 2010
3.4
+0.014
0.41%
jan 1, 2011
3.409
+0.009
0.25%
jan 1, 2012
3.382
-0.026
-0.77%
jan 1, 2013
3.362
-0.021
-0.62%
jan 1, 2014
3.33
-0.032
-0.94%
jan 1, 2015
3.326
-0.004
-0.13%
jan 1, 2016
3.312
-0.014
-0.41%
Ranking of countries by current statistics by years
About & Feedback
Terms
Privacy
FAQ
Support 24/7
Cabinet
Get premium
Donate
The service accepts bank transfer (ACH, Wire) or cards (Visa, MasterCard, etc). Processed by Stripe.
Secured with SSL