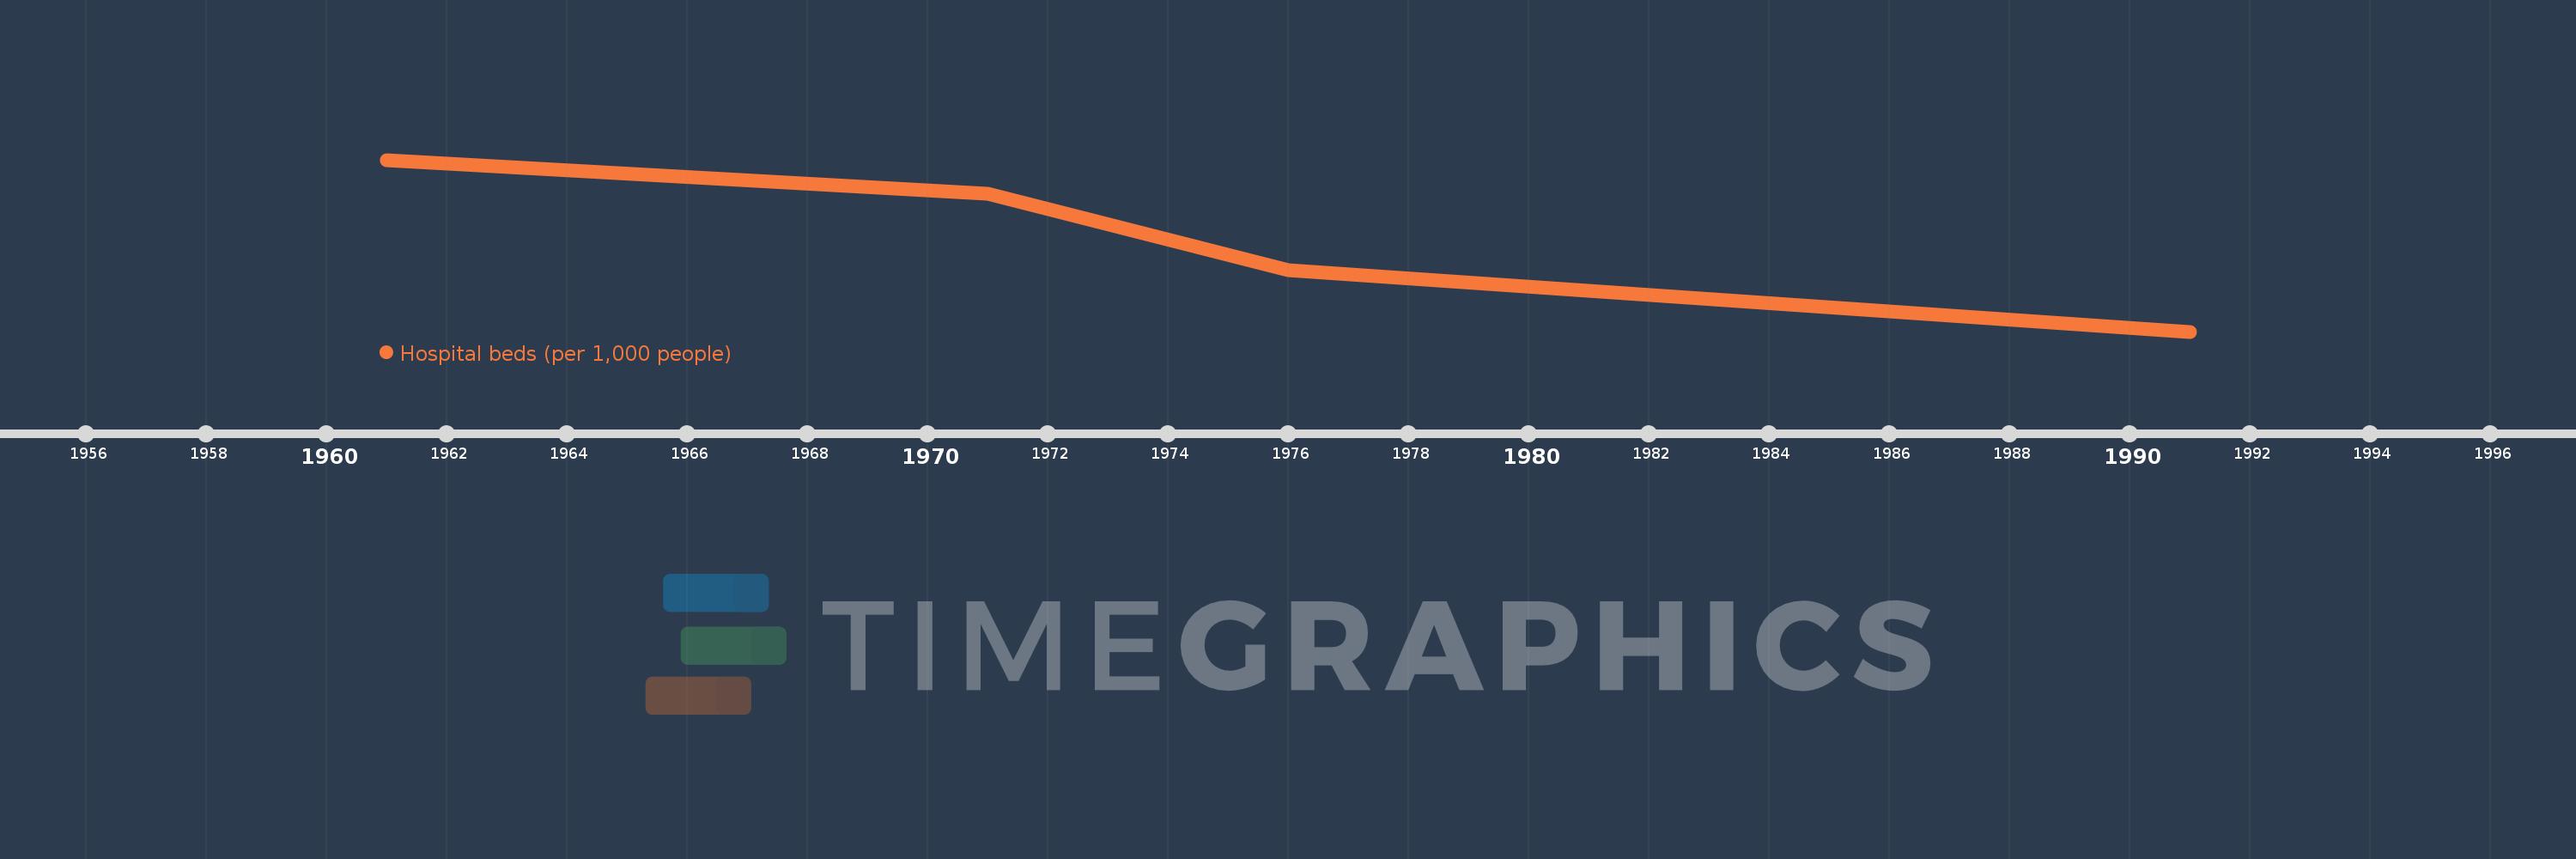
This timeline shows a graph from 1961 to 1991 of Sub-Saharan Africa (excluding high income). No data until 1960. Number of actual observations by date: 4.
Source name:
World Development Indicators
Source organization:
Data are from the World Health Organization, supplemented by country data.
Categories, topics:
Health
Last updated:
apr 23, 2017
Indicators value changes by year
Meaning:
1.312
Minimum:
1.214
jan 1, 1991
Maximum:
1.396
jan 1, 1961
At the date of observation
Value
Absolute change
Change from the previous value
jan 1, 1961
1.396
+1.396
0.0%
jan 1, 1971
1.36
-0.037
-2.64%
jan 1, 1976
1.279
-0.081
-5.95%
jan 1, 1991
1.214
-0.064
-5.03%
Ranking of countries by current statistics by years