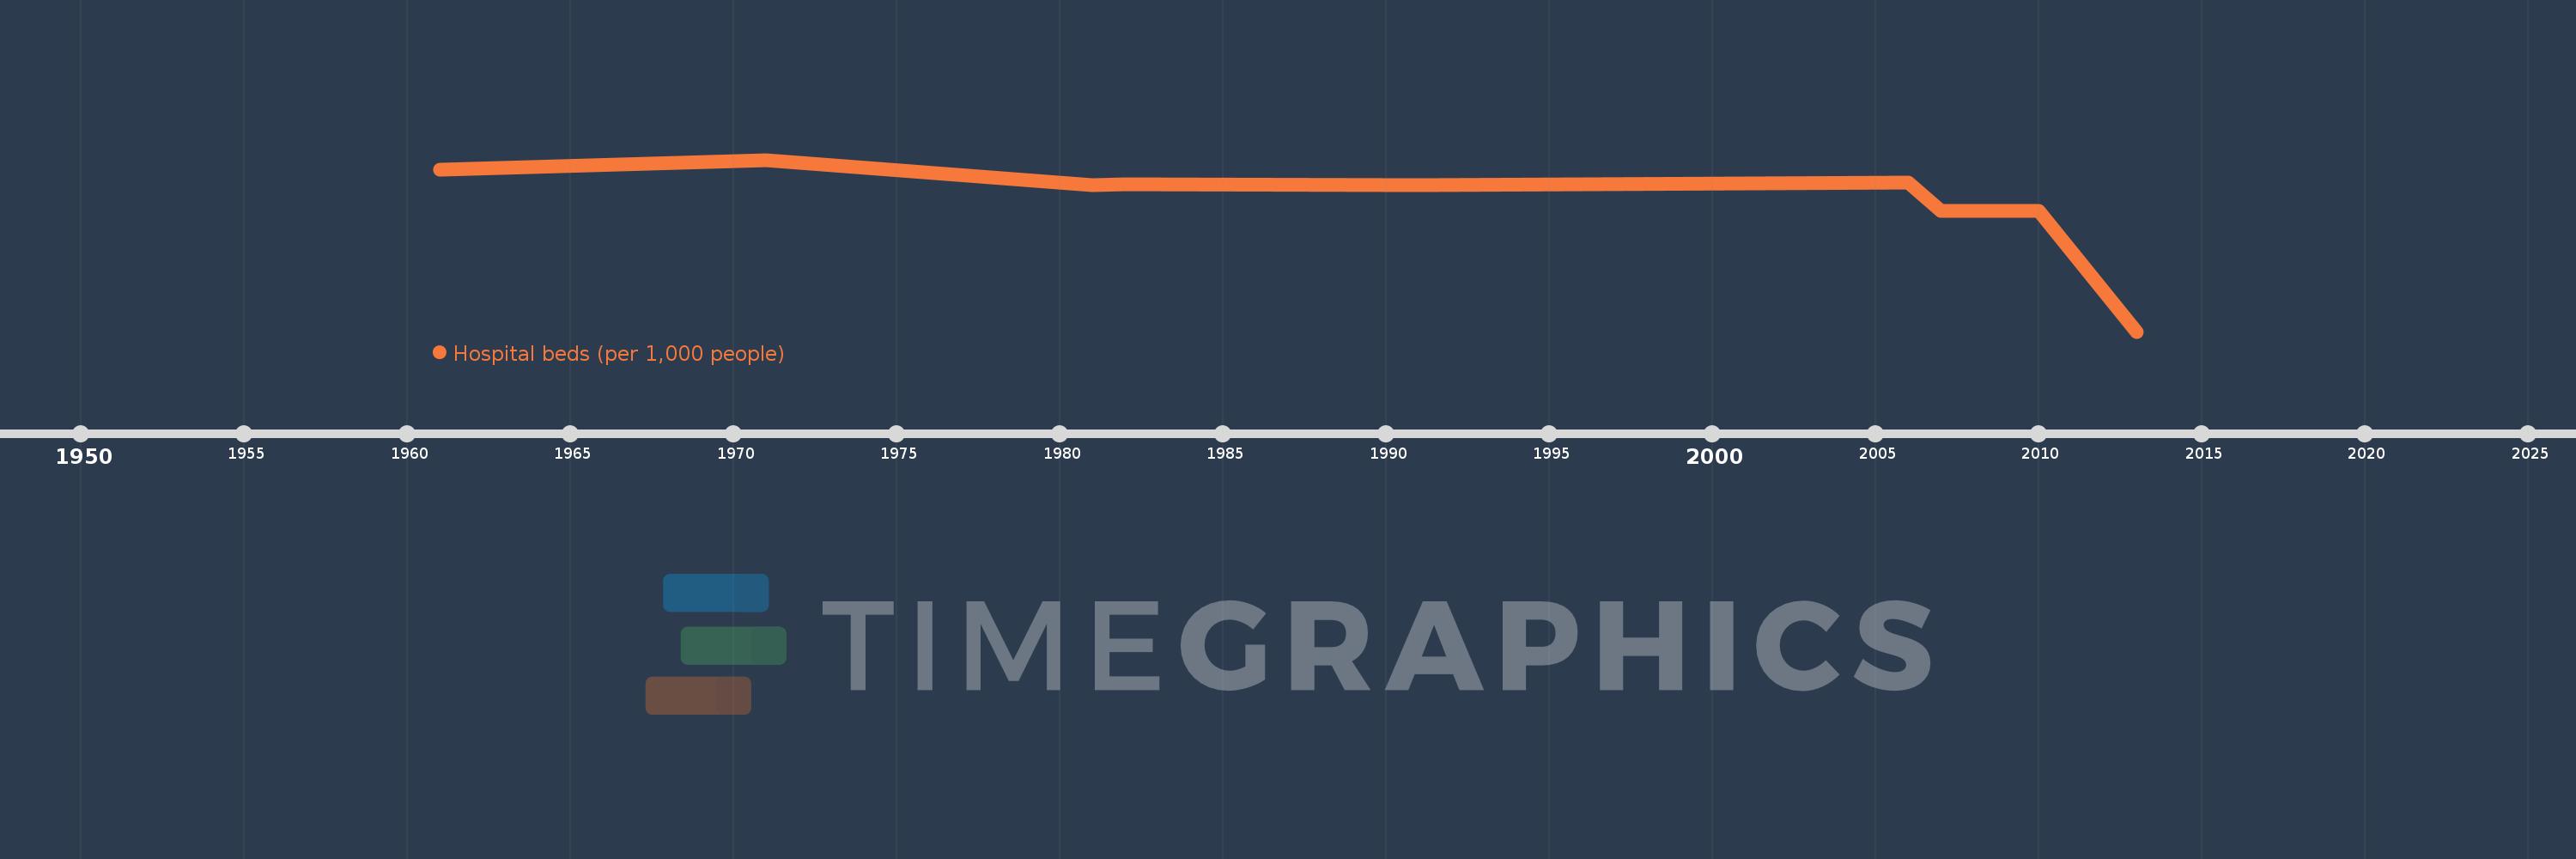
This timeline shows a graph from 1961 to 2013 of Middle East & North Africa (IDA & IBRD countries). No data until 1960. Number of actual observations by date: 9.
Source name:
World Development Indicators
Source organization:
Data are from the World Health Organization, supplemented by country data.
Categories, topics:
Health
Last updated:
apr 23, 2017
Indicators value changes by year
Meaning:
1.639
Minimum:
0.818
jan 1, 2013
Maximum:
1.909
jan 1, 1971
At the date of observation
Value
Absolute change
Change from the previous value
jan 1, 1961
1.848
+1.848
0.0%
jan 1, 1971
1.909
+0.061
3.3%
jan 1, 1981
1.748
-0.161
-8.43%
jan 1, 1982
1.751
+0.004
0.21%
jan 1, 1991
1.749
-0.002
-0.12%
jan 1, 2006
1.765
+0.016
0.89%
jan 1, 2007
1.584
-0.181
-10.27%
jan 1, 2010
1.583
0.0
-0.01%
jan 1, 2013
0.818
-0.766
-48.37%
Ranking of countries by current statistics by years