33
/
AIzaSyB4mHJ5NPEv-XzF7P6NDYXjlkCWaeKw5bc
November 30, 2025
30747
Europe & Central Asia
ECS
false
2
1
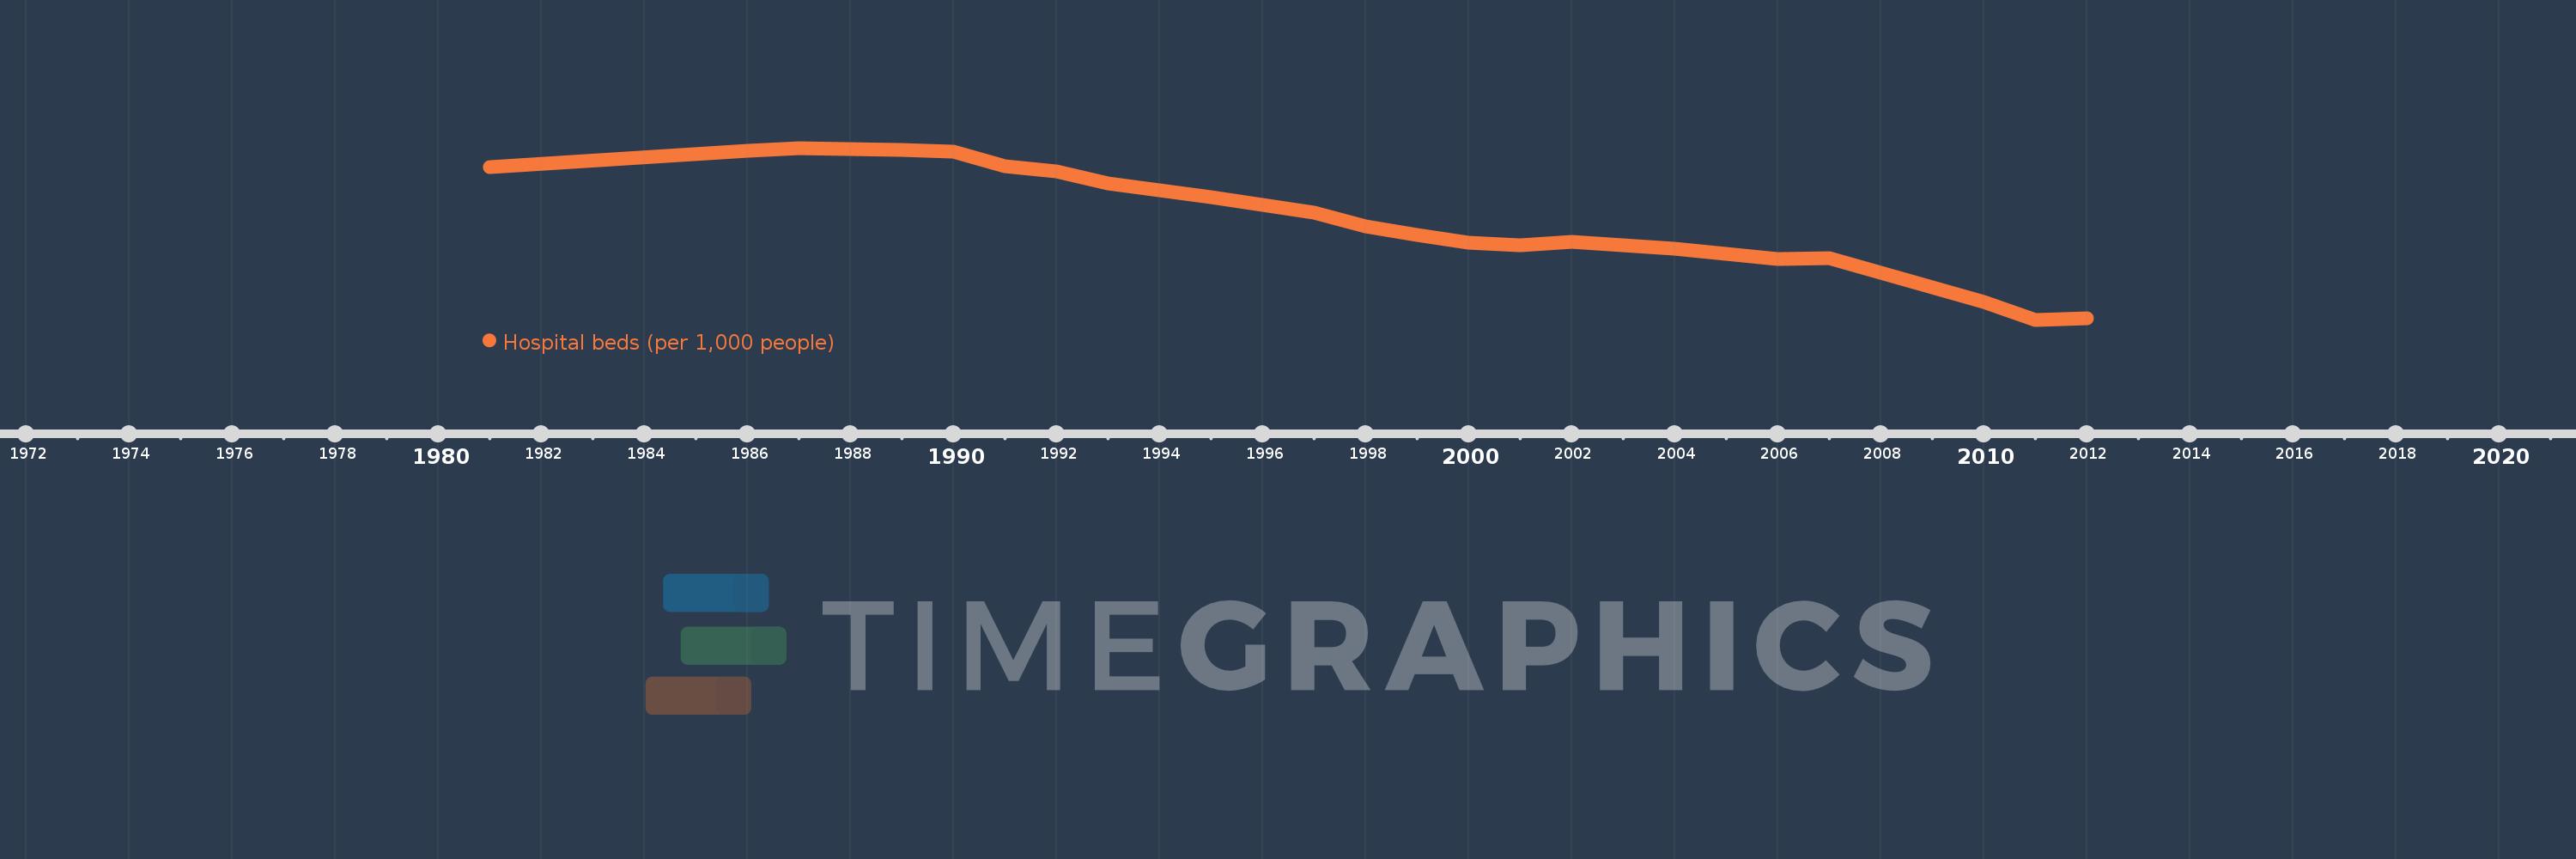
Hospital beds (per 1,000 people)
2012,2011,2010,2007,2006,2004,2002,2001,2000,1999,1998,1997,1996,1995,1994,1993,1992,1991,1990,1989,1988,1987,1986,1981