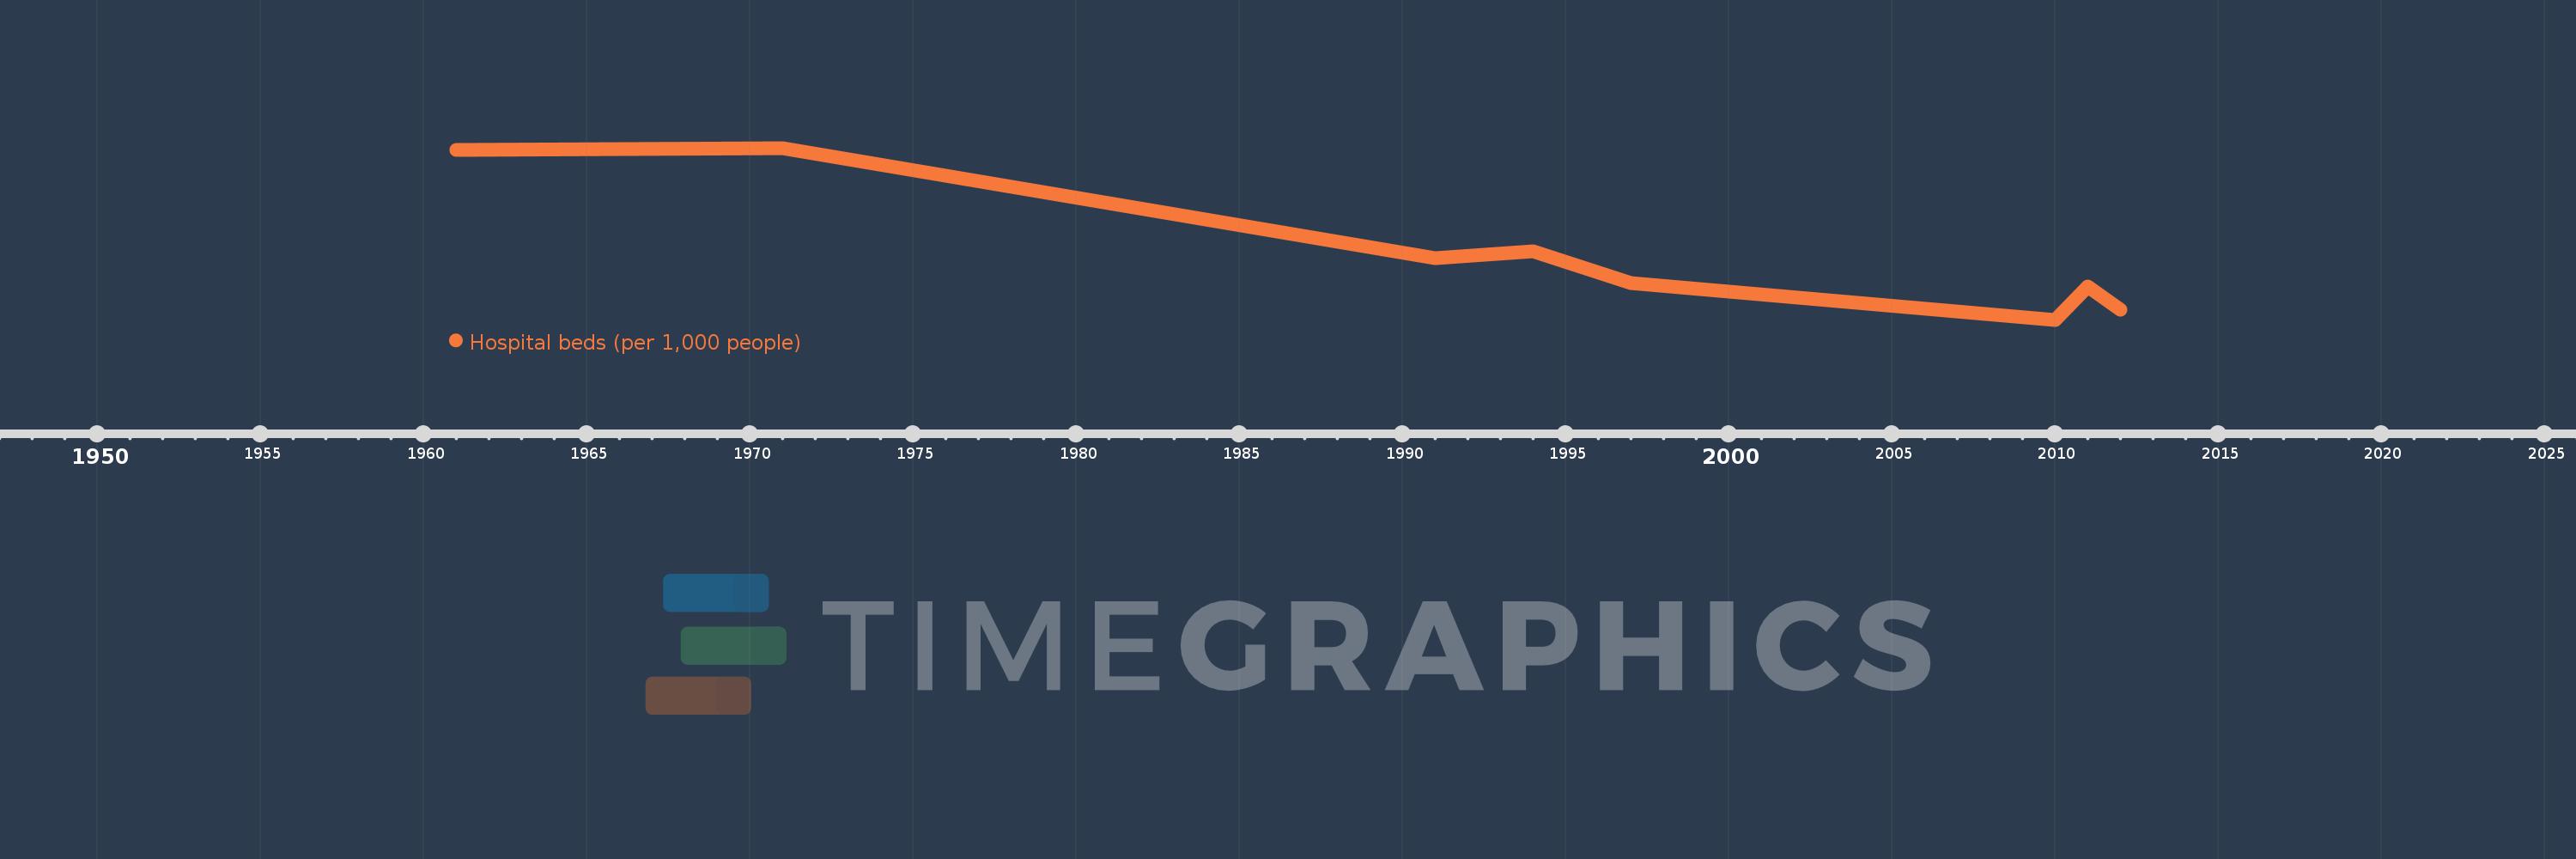
This timeline shows a graph from 1961 to 2012 of Latin America & the Caribbean (IDA & IBRD countries). No data until 1960. Number of actual observations by date: 8.
Source name:
World Development Indicators
Source organization:
Data are from the World Health Organization, supplemented by country data.
Categories, topics:
Health
Last updated:
apr 23, 2017
Indicators value changes by year
Meaning:
2.473
Minimum:
1.849
jan 1, 2010
Maximum:
3.407
jan 1, 1971
At the date of observation
Value
Absolute change
Change from the previous value
jan 1, 1961
3.386
+3.386
0.0%
jan 1, 1971
3.407
+0.022
0.64%
jan 1, 1991
2.404
-1.004
-29.46%
jan 1, 1994
2.473
+0.069
2.88%
jan 1, 1997
2.178
-0.295
-11.93%
jan 1, 2010
1.849
-0.329
-15.09%
jan 1, 2011
2.149
+0.3
16.23%
jan 1, 2012
1.942
-0.208
-9.67%
Ranking of countries by current statistics by years