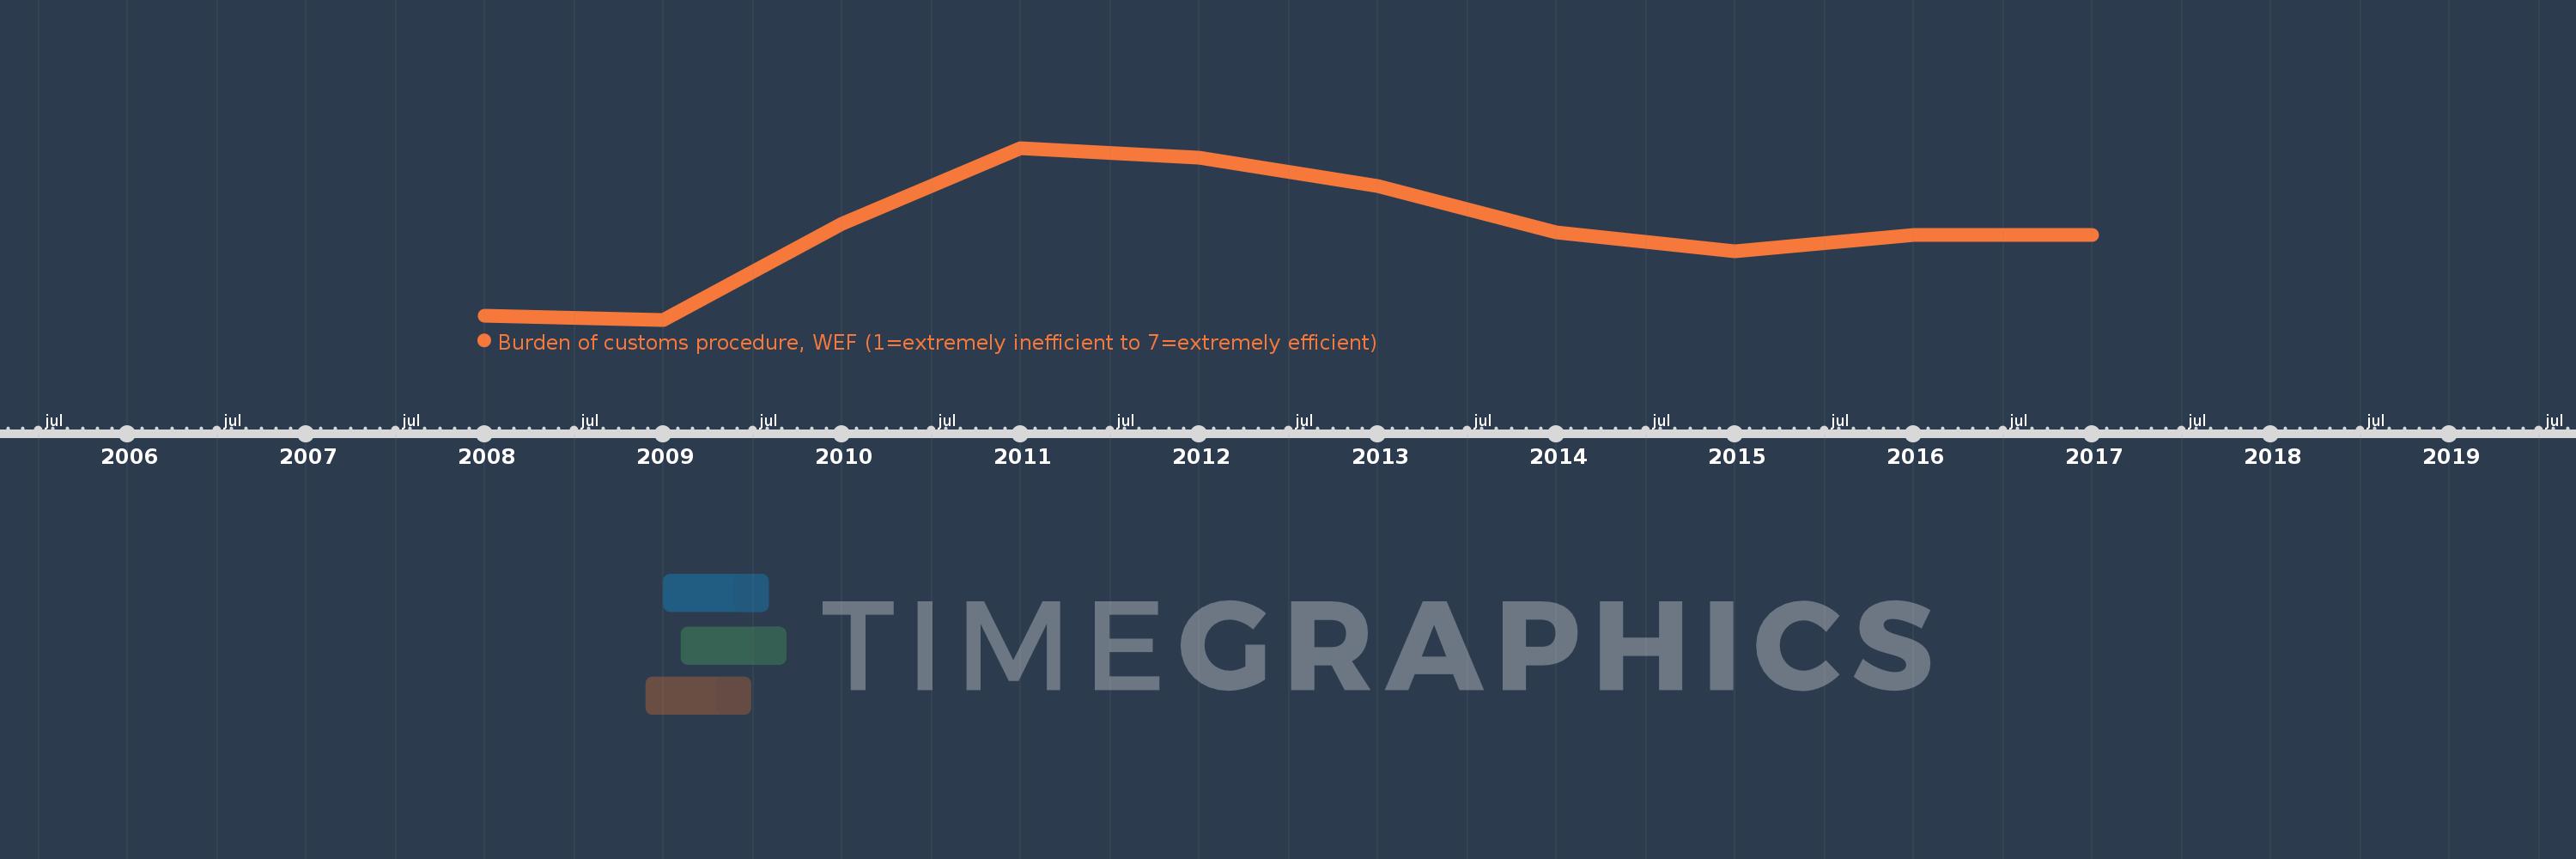
This timeline shows a graph from 2008 to 2017 of Sub-Saharan Africa (excluding high income). No data until 2007. Number of actual observations by date: 10.
Source name:
World Development Indicators
Source organization:
World Economic Forum, Global Competiveness Report and data files.
Categories, topics:
Private Sector
Last updated:
apr 23, 2017
Indicators value changes by year
Meaning:
3.601
Minimum:
3.275
jan 1, 2009
Maximum:
3.901
jan 1, 2011
At the date of observation
Value
Absolute change
Change from the previous value
jan 1, 2008
3.291
+3.291
0.0%
jan 1, 2009
3.275
-0.016
-0.48%
jan 1, 2010
3.626
+0.352
10.73%
jan 1, 2011
3.901
+0.275
7.58%
jan 1, 2012
3.867
-0.035
-0.89%
jan 1, 2013
3.761
-0.106
-2.74%
jan 1, 2014
3.594
-0.166
-4.43%
jan 1, 2015
3.525
-0.069
-1.92%
jan 1, 2016
3.583
+0.058
1.64%
jan 1, 2017
3.584
+0.002
0.04%
Ranking of countries by current statistics by years