33
/
AIzaSyB4mHJ5NPEv-XzF7P6NDYXjlkCWaeKw5bc
November 30, 2025
32419
Europe & Central Asia (IDA & IBRD countries)
TEC
false
2
1
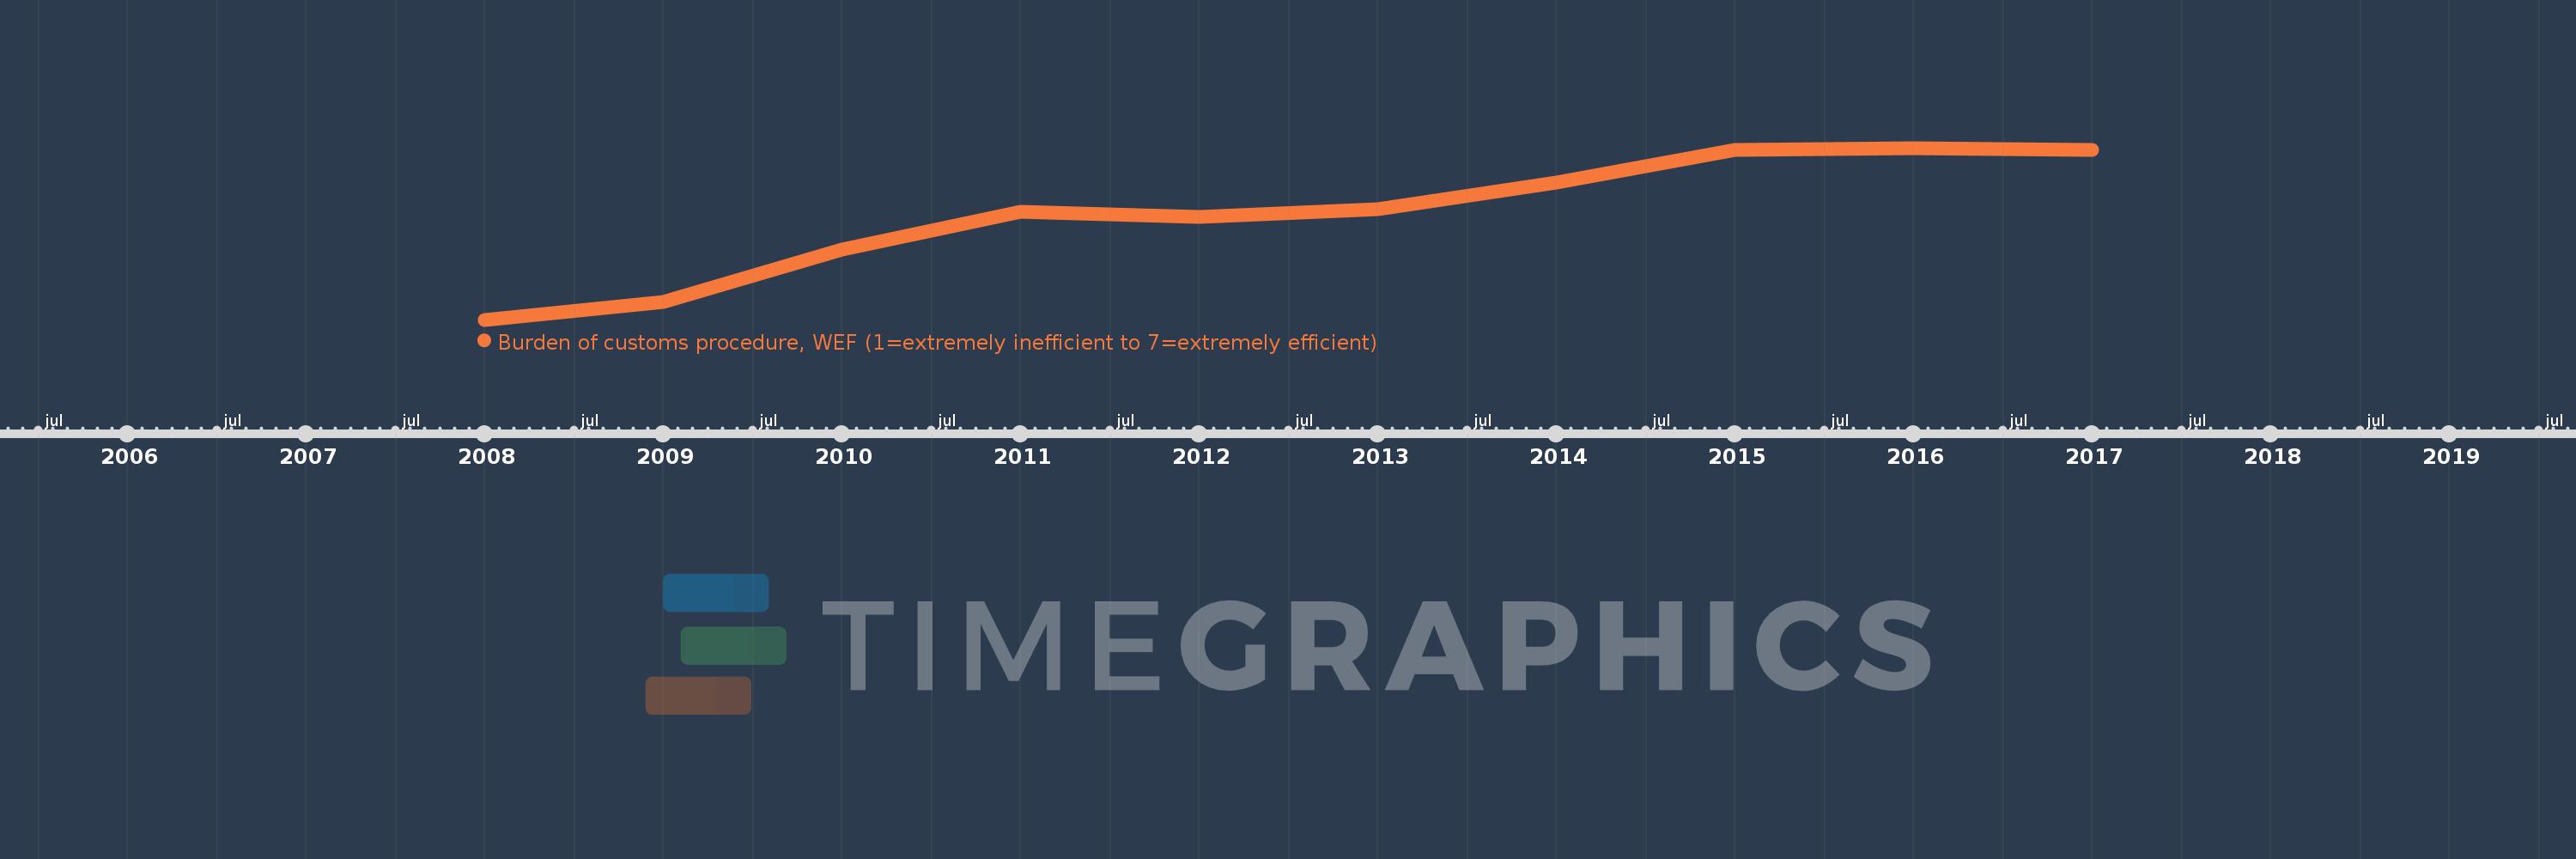
Burden of customs procedure, WEF (1=extremely inefficient to 7=extremely efficient)
2017,2016,2015,2014,2013,2012,2011,2010,2009,2008