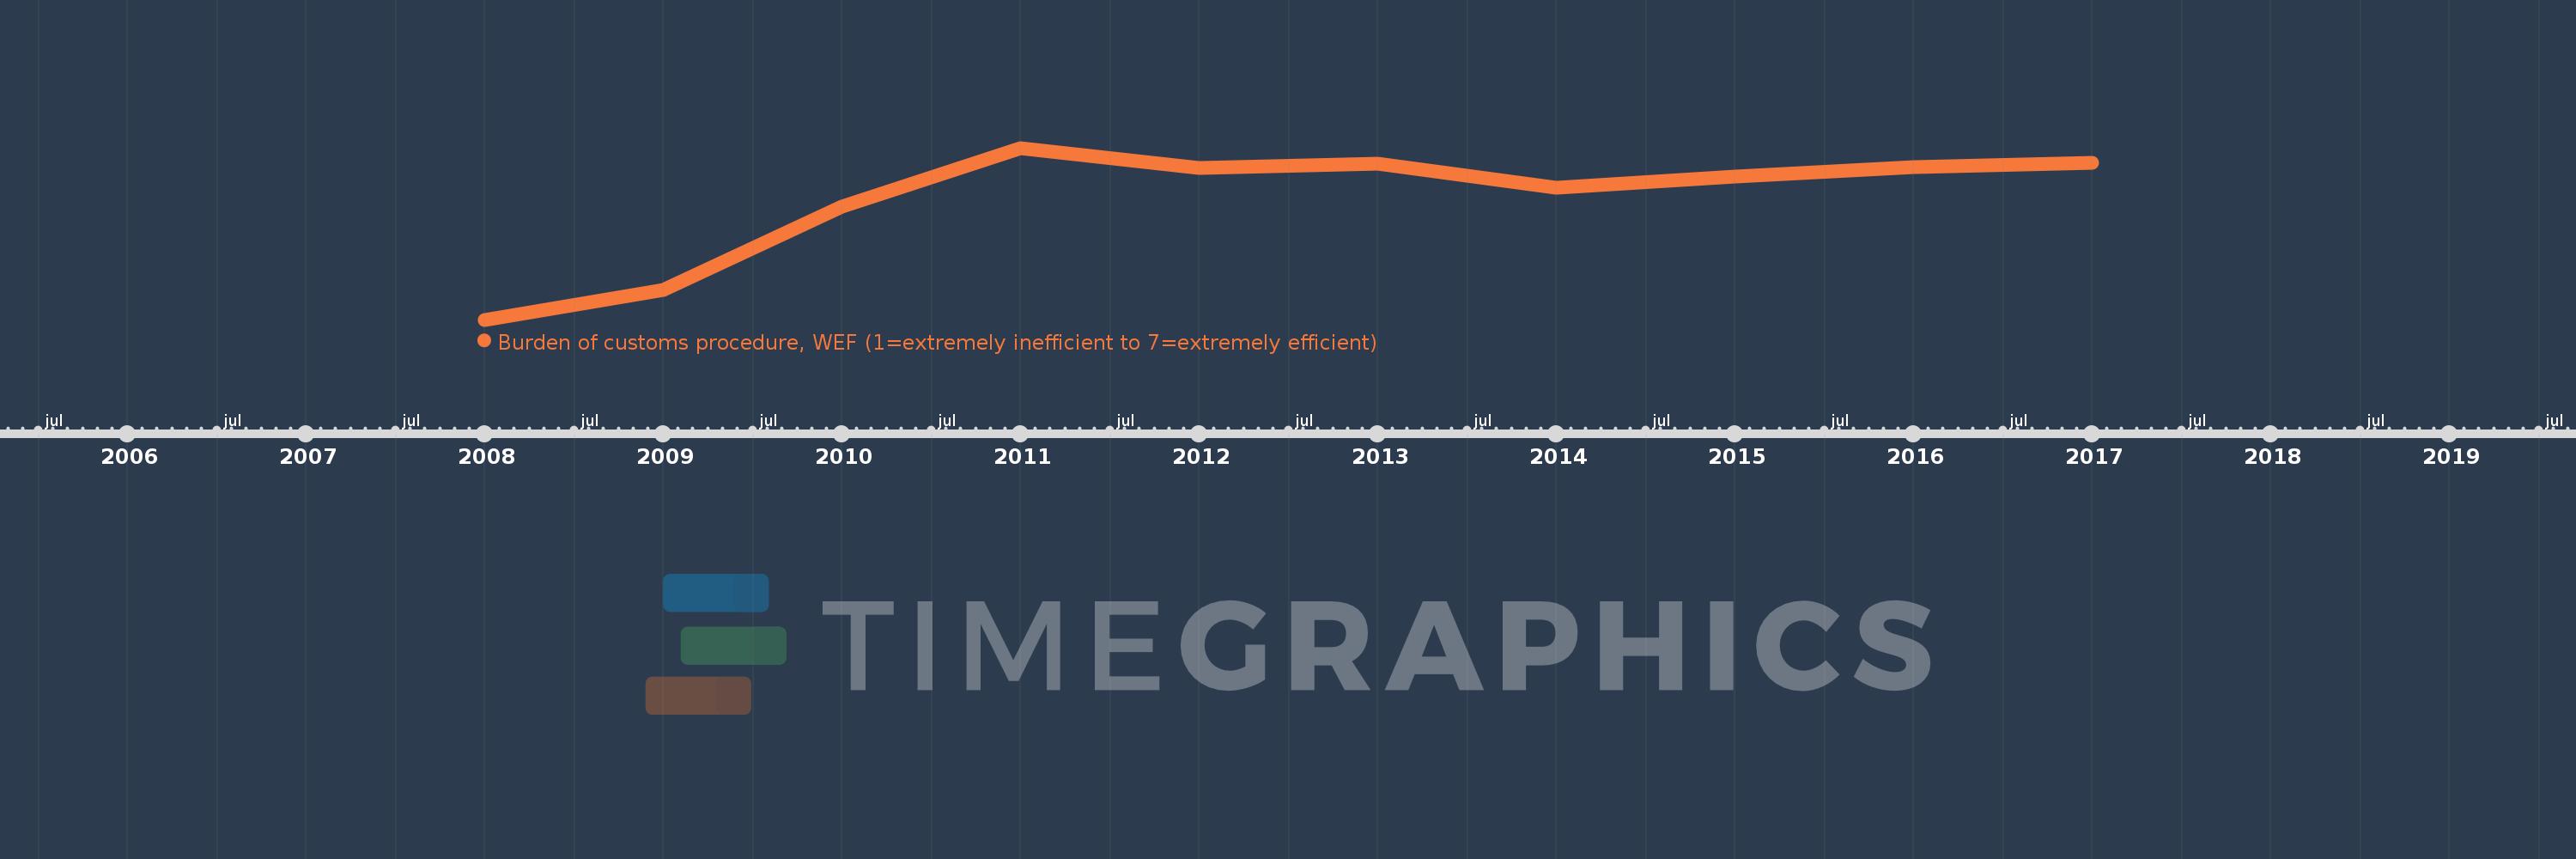
This timeline shows a graph from 2008 to 2017 of East Asia & Pacific (excluding high income). No data until 2007. Number of actual observations by date: 10.
Source name:
World Development Indicators
Source organization:
World Economic Forum, Global Competiveness Report and data files.
Categories, topics:
Private Sector
Last updated:
apr 23, 2017
Indicators value changes by year
Meaning:
3.698
Minimum:
3.387
jan 1, 2008
Maximum:
3.829
jan 1, 2011
At the date of observation
Value
Absolute change
Change from the previous value
jan 1, 2008
3.387
+3.387
0.0%
jan 1, 2009
3.464
+0.076
2.25%
jan 1, 2010
3.678
+0.214
6.18%
jan 1, 2011
3.829
+0.152
4.12%
jan 1, 2012
3.778
-0.052
-1.35%
jan 1, 2013
3.789
+0.011
0.29%
jan 1, 2014
3.727
-0.062
-1.63%
jan 1, 2015
3.755
+0.027
0.73%
jan 1, 2016
3.779
+0.025
0.66%
jan 1, 2017
3.79
+0.011
0.28%
Ranking of countries by current statistics by years