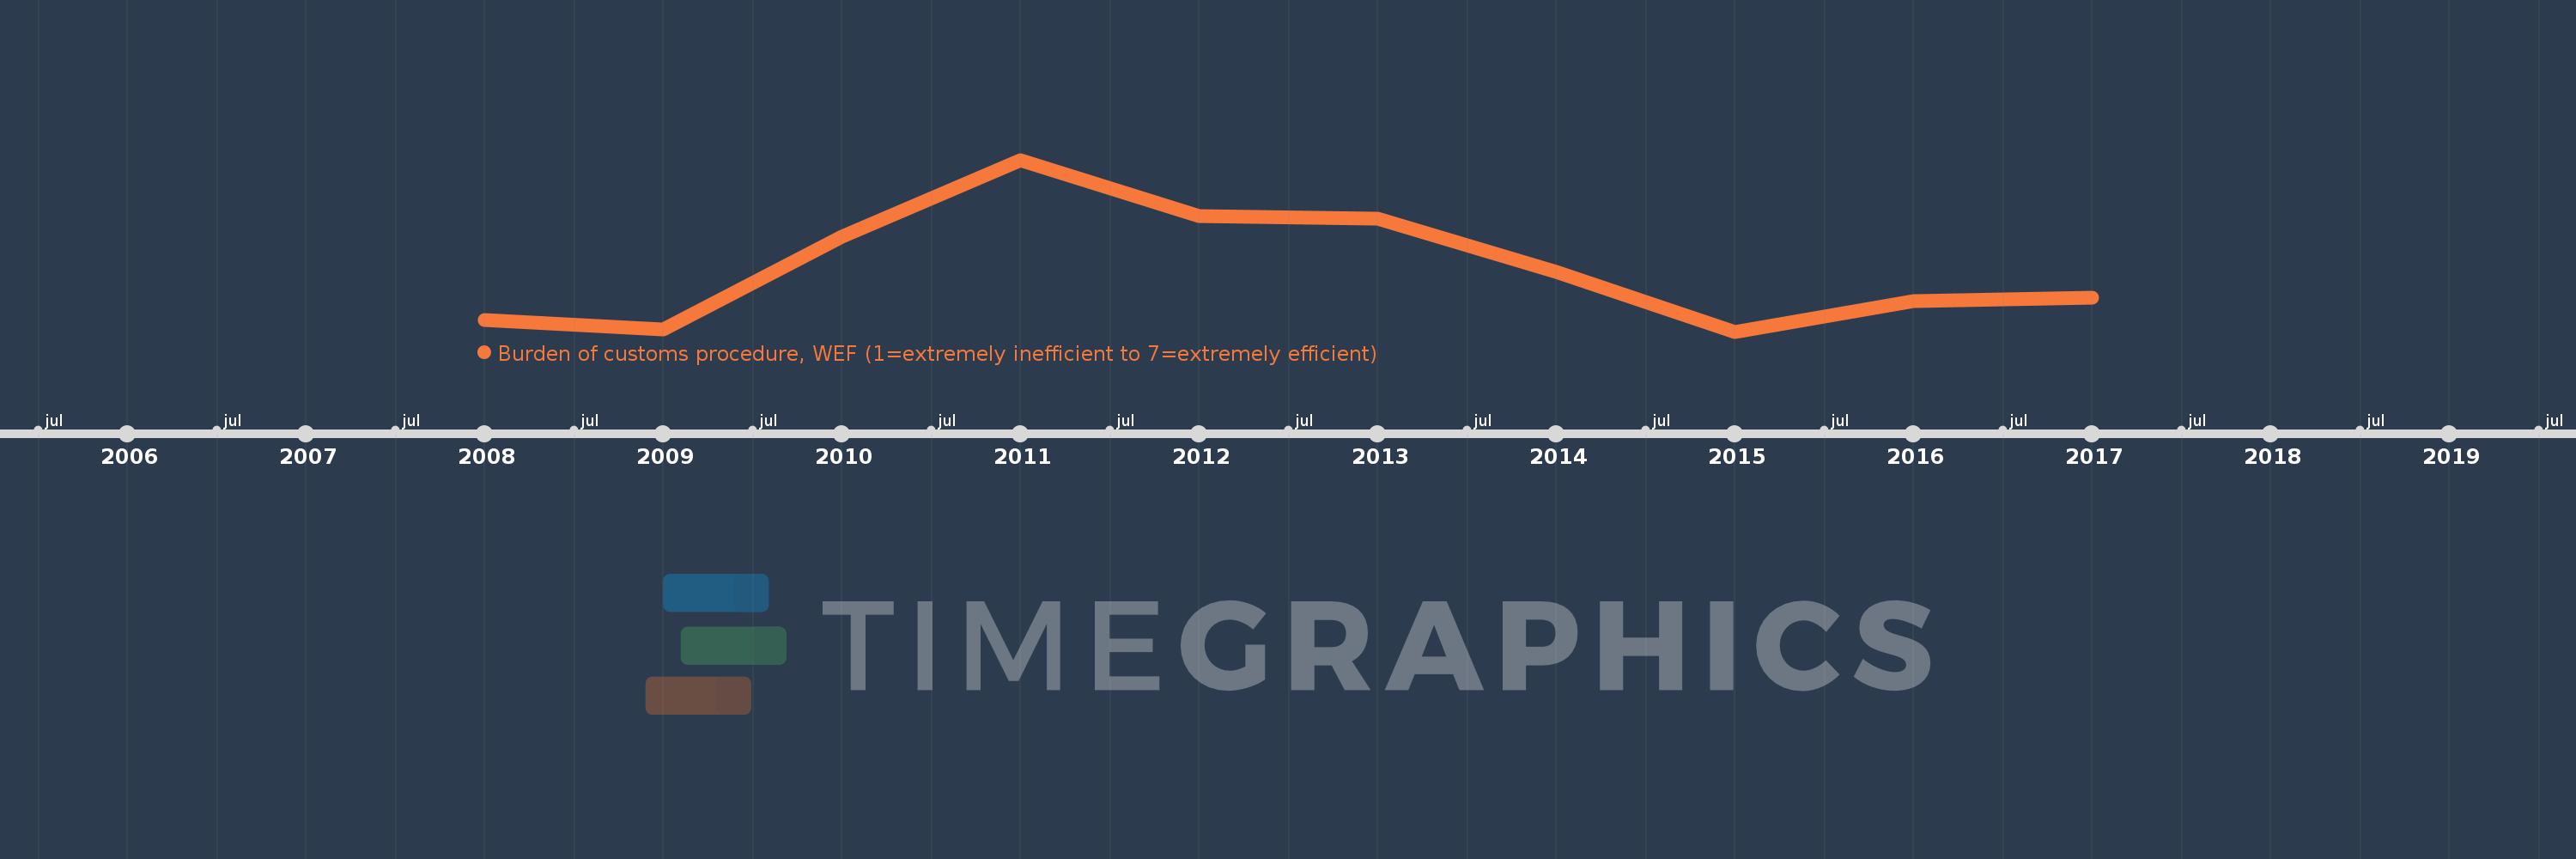
This timeline shows a graph from 2008 to 2017 of Fragile and conflict affected situations. No data until 2007. Number of actual observations by date: 10.
Source name:
World Development Indicators
Source organization:
World Economic Forum, Global Competiveness Report and data files.
Categories, topics:
Private Sector
Last updated:
apr 23, 2017
Indicators value changes by year
Meaning:
3.283
Minimum:
3.085
jan 1, 2015
Maximum:
3.621
jan 1, 2011
At the date of observation
Value
Absolute change
Change from the previous value
jan 1, 2008
3.121
+3.121
0.0%
jan 1, 2009
3.093
-0.028
-0.91%
jan 1, 2010
3.38
+0.287
9.28%
jan 1, 2011
3.621
+0.242
7.15%
jan 1, 2012
3.445
-0.176
-4.86%
jan 1, 2013
3.438
-0.007
-0.2%
jan 1, 2014
3.271
-0.167
-4.86%
jan 1, 2015
3.085
-0.187
-5.71%
jan 1, 2016
3.179
+0.094
3.06%
jan 1, 2017
3.192
+0.013
0.4%
Ranking of countries by current statistics by years