Download This statistics in other country:
Timeline:
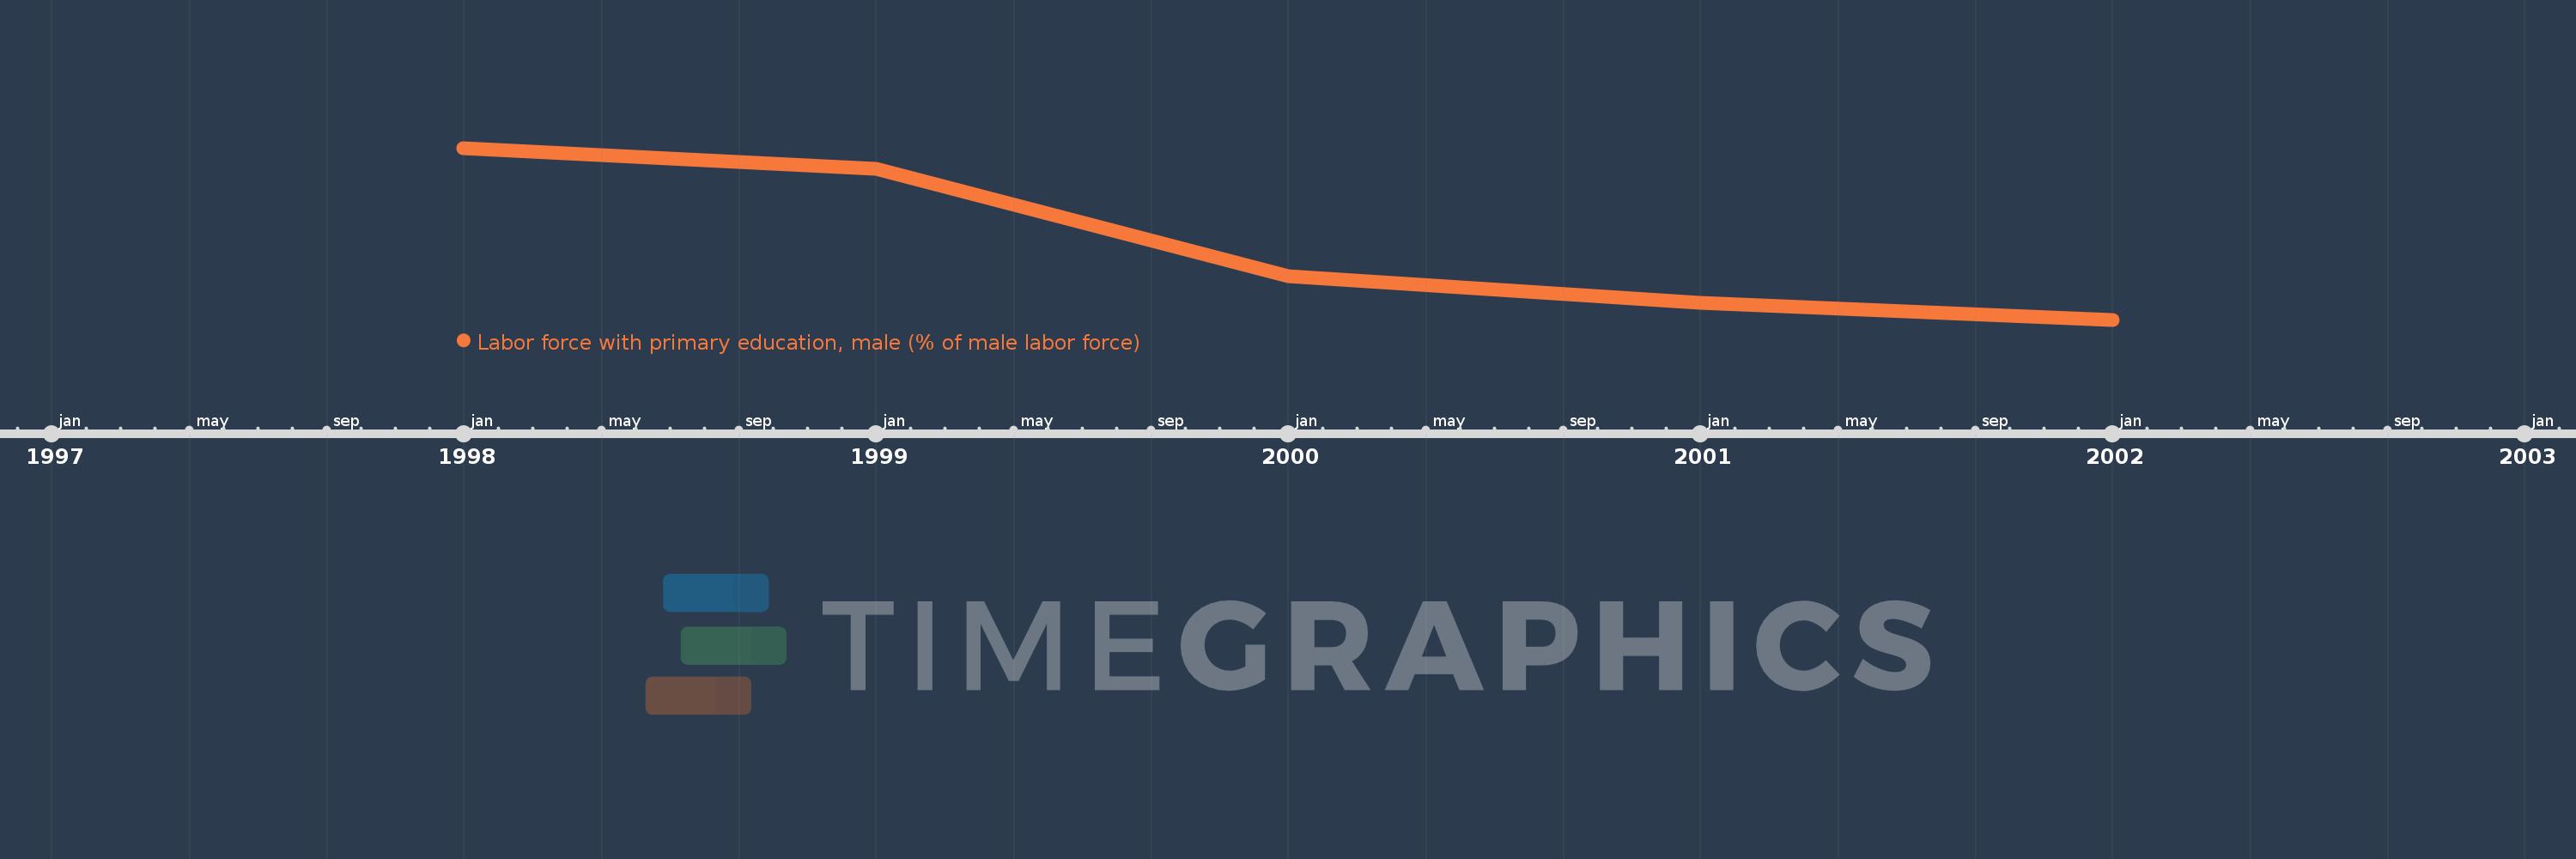
This timeline shows a graph from 1998 to 2002 of Post-demographic dividend. No data until 1997. Number of actual observations by date: 5.
Source name:
World Development Indicators
Source organization:
International Labour Organization, Key Indicators of the Labour Market database.
Categories, topics:
Education, Social Protection & Labor, Gender
Last updated:
apr 23, 2017
Indicators value changes by year
Minimum:
22.449
jan 1, 2002
Maximum:
26.738
jan 1, 1998
At the date of observation
Value
Absolute change
Change from the previous value
jan 1, 1998
26.738
+26.738
0.0%
jan 1, 1999
26.215
-0.523
-1.96%
jan 1, 2000
23.546
-2.669
-10.18%
jan 1, 2001
22.864
-0.682
-2.9%
jan 1, 2002
22.449
-0.415
-1.81%
Ranking of countries by current statistics by years