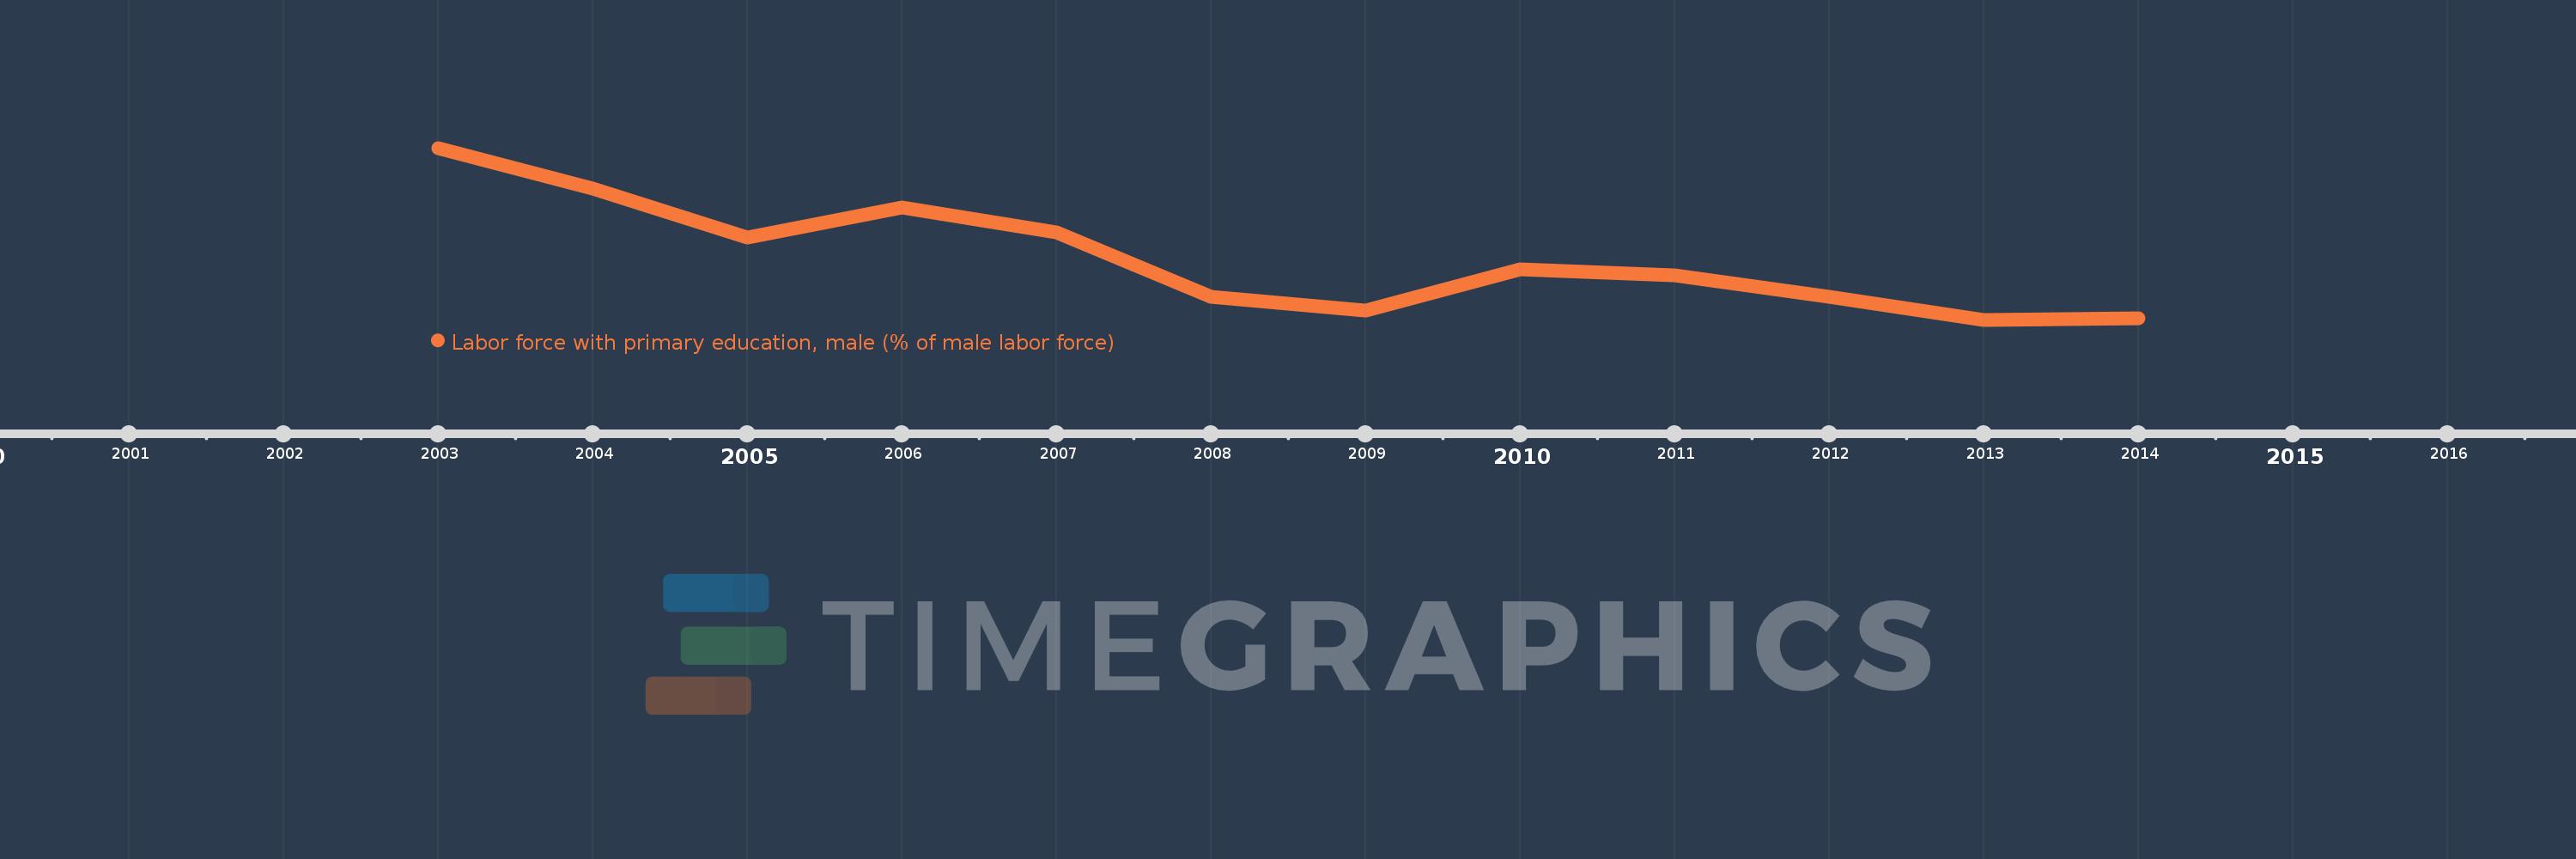
This timeline shows a graph from 2003 to 2014 of Europe & Central Asia (IDA & IBRD countries). No data until 2002. Number of actual observations by date: 12.
Source name:
World Development Indicators
Source organization:
International Labour Organization, Key Indicators of the Labour Market database.
Categories, topics:
Education, Social Protection & Labor, Gender
Last updated:
apr 23, 2017
Indicators value changes by year
Meaning:
21.494
Minimum:
19.976
jan 1, 2013
Maximum:
24.222
jan 1, 2003
At the date of observation
Value
Absolute change
Change from the previous value
jan 1, 2003
24.222
+24.222
0.0%
jan 1, 2004
23.225
-0.997
-4.12%
jan 1, 2005
22.004
-1.221
-5.26%
jan 1, 2006
22.747
+0.743
3.38%
jan 1, 2007
22.125
-0.623
-2.74%
jan 1, 2008
20.548
-1.577
-7.13%
jan 1, 2009
20.212
-0.335
-1.63%
jan 1, 2010
21.232
+1.019
5.04%
jan 1, 2011
21.075
-0.157
-0.74%
jan 1, 2012
20.55
-0.525
-2.49%
jan 1, 2013
19.976
-0.573
-2.79%
jan 1, 2014
20.008
+0.032
0.16%
Ranking of countries by current statistics by years