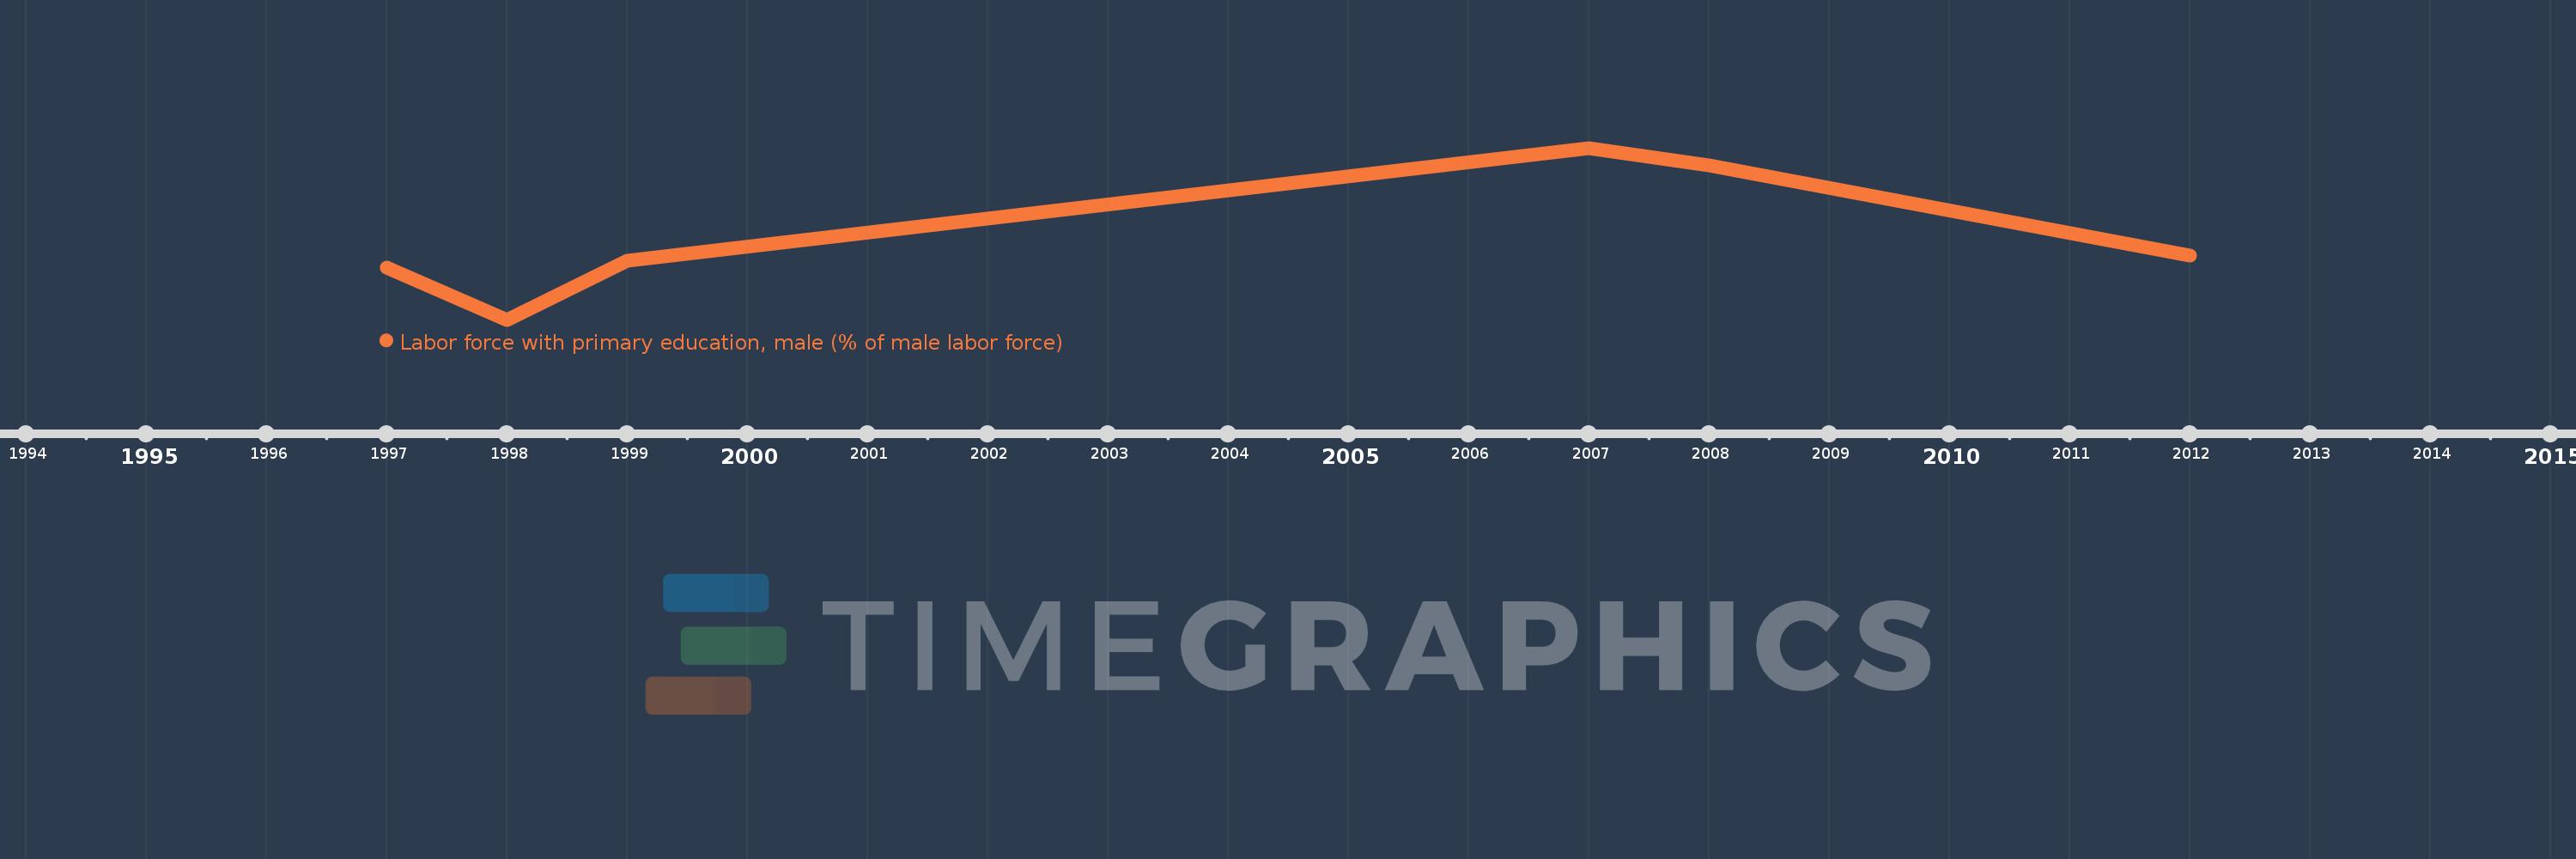
This timeline shows a graph from 1997 to 2012 of Latin America & the Caribbean (IDA & IBRD countries). No data until 1996. Number of actual observations by date: 6.
Source name:
World Development Indicators
Source organization:
International Labour Organization, Key Indicators of the Labour Market database.
Categories, topics:
Education, Social Protection & Labor, Gender
Last updated:
apr 23, 2017
Indicators value changes by year
Meaning:
37.22
Minimum:
27.11
jan 1, 1998
Maximum:
47.883
jan 1, 2007
At the date of observation
Value
Absolute change
Change from the previous value
jan 1, 1997
33.438
+33.438
0.0%
jan 1, 1998
27.11
-6.328
-18.93%
jan 1, 1999
34.283
+7.174
26.46%
jan 1, 2007
47.883
+13.6
39.67%
jan 1, 2008
45.756
-2.127
-4.44%
jan 1, 2012
34.851
-10.905
-23.83%
Ranking of countries by current statistics by years