33
/
AIzaSyB4mHJ5NPEv-XzF7P6NDYXjlkCWaeKw5bc
November 30, 2025
195772
Mexico
MEX
true
2
1
Labor force with primary education, male (% of male labor force)
2012,2009,2008,2007,2006,2005,2004,2003,2002,2001,2000,1999,1998,1997,1996
Create a timeline
Public Timelines
For education
For educational institutions
For teachers
For students
Cabinet
For educational institutions
For teachers
For students
Open cabinet
FAQ
Close
Create a timeline
Public timelines
FAQ
About & Feedback
Terms
Privacy
FAQ
Support 24/7
Cabinet
Get premium
Donate
Download
Global statistics library
→
Mexico
→
Labor force with primary education, male (% of male labor force)
This statistics in other country:
Albania
Algeria
Antigua and Barbuda
Argentina
Armenia
Aruba
Australia
Austria
Azerbaijan
Bahamas, The
Bahrain
Barbados
Belarus
Belgium
Belize
Bermuda
Bolivia
Bosnia and Herzegovina
Botswana
Brazil
British Virgin Islands
Bulgaria
Canada
Cayman Islands
Central Europe and the Baltics
Chad
Chile
Colombia
Costa Rica
Croatia
Cuba
Cyprus
Czech Republic
Denmark
Dominica
Dominican Republic
Ecuador
Egypt, Arab Rep.
El Salvador
Estonia
Ethiopia
Euro area
Europe & Central Asia
Europe & Central Asia (excluding high income)
Europe & Central Asia (IDA & IBRD countries)
European Union
Finland
France
Georgia
Germany
Ghana
Greece
Guatemala
Guyana
High income
Honduras
Hong Kong SAR, China
Hungary
Iceland
India
Indonesia
Iran, Islamic Rep.
Ireland
Israel
Italy
Japan
Jordan
Kazakhstan
Korea, Rep.
Kuwait
Kyrgyz Republic
Latin America & Caribbean
Latin America & Caribbean (excluding high income)
Latin America & the Caribbean (IDA & IBRD countries)
Latvia
Lebanon
Lithuania
Luxembourg
Macao SAR, China
Macedonia, FYR
Madagascar
Malaysia
Malta
Mauritius
Mexico
Moldova
Mongolia
Montenegro
Morocco
Namibia
Nepal
Netherlands
New Zealand
Nicaragua
Niger
Nigeria
North America
Norway
OECD members
Oman
Pakistan
Panama
Paraguay
Peru
Philippines
Poland
Portugal
Post-demographic dividend
Romania
Russian Federation
Rwanda
San Marino
Saudi Arabia
Serbia
Singapore
Slovak Republic
Slovenia
South Africa
South Asia
South Asia (IDA & IBRD)
Spain
Sri Lanka
St. Kitts and Nevis
St. Lucia
St. Vincent and the Grenadines
Sweden
Switzerland
Syrian Arab Republic
Tajikistan
Thailand
Timor-Leste
Trinidad and Tobago
Tunisia
Turkey
Uganda
Ukraine
United Arab Emirates
United Kingdom
United States
Uruguay
Venezuela, RB
West Bank and Gaza
Yemen, Rep.
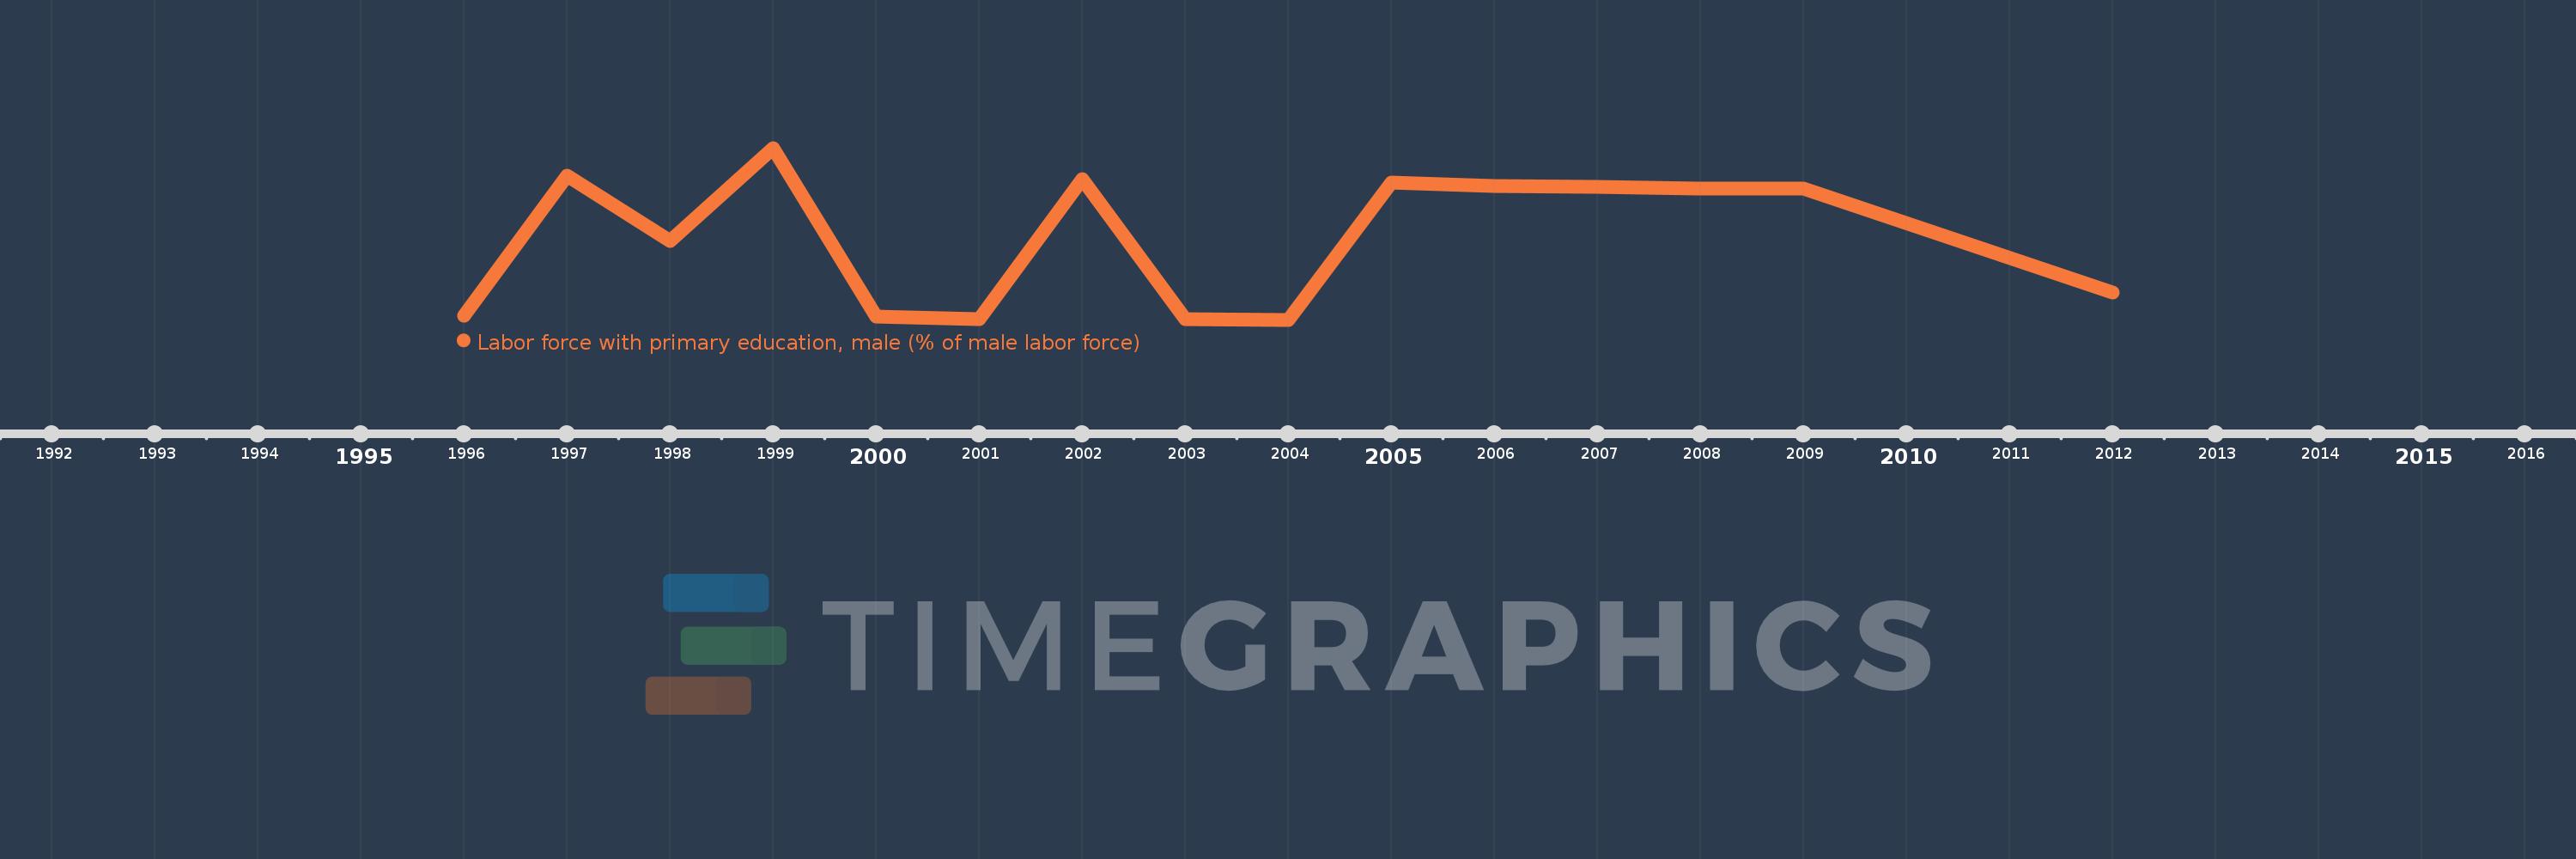
Timeline:
This timeline shows a graph from
1996
to
2012
of Mexico. No data until
1995
. Number of actual observations by date:
15
.
Source name:
World Development Indicators
Source organization:
International Labour Organization, Key Indicators of the Labour Market database.
Categories, topics:
Education, Social Protection & Labor, Gender
Last updated:
apr 23, 2017
Indicators value changes by year
Meaning:
45.087
Minimum:
20.0
jan 1, 2004
Maximum:
72.3
jan 1, 1999
At the date of observation
Value
Absolute change
Change from the previous value
jan 1, 1996
21.2
+21.2
0.0%
jan 1, 1997
63.9
+42.7
201.42%
jan 1, 1998
44.1
-19.8
-30.99%
jan 1, 1999
72.3
+28.2
63.95%
jan 1, 2000
20.9
-51.4
-71.09%
jan 1, 2001
20.3
-0.6
-2.87%
jan 1, 2002
62.7
+42.4
208.87%
jan 1, 2003
20.1
-42.6
-67.94%
jan 1, 2004
20.0
-0.1
-0.5%
jan 1, 2005
61.8
+41.8
209.0%
jan 1, 2006
60.6
-1.2
-1.94%
jan 1, 2007
60.4
-0.2
-0.33%
jan 1, 2008
59.9
-0.5
-0.83%
jan 1, 2009
59.9
0.0
0.0%
jan 1, 2012
28.2
-31.7
-52.92%
Ranking of countries by current statistics by years
About & Feedback
Terms
Privacy
FAQ
Support 24/7
Cabinet
Get premium
Donate
The service accepts bank transfer (ACH, Wire) or cards (Visa, MasterCard, etc). Processed by Stripe.
Secured with SSL