Download This statistics in other country:
Timeline:
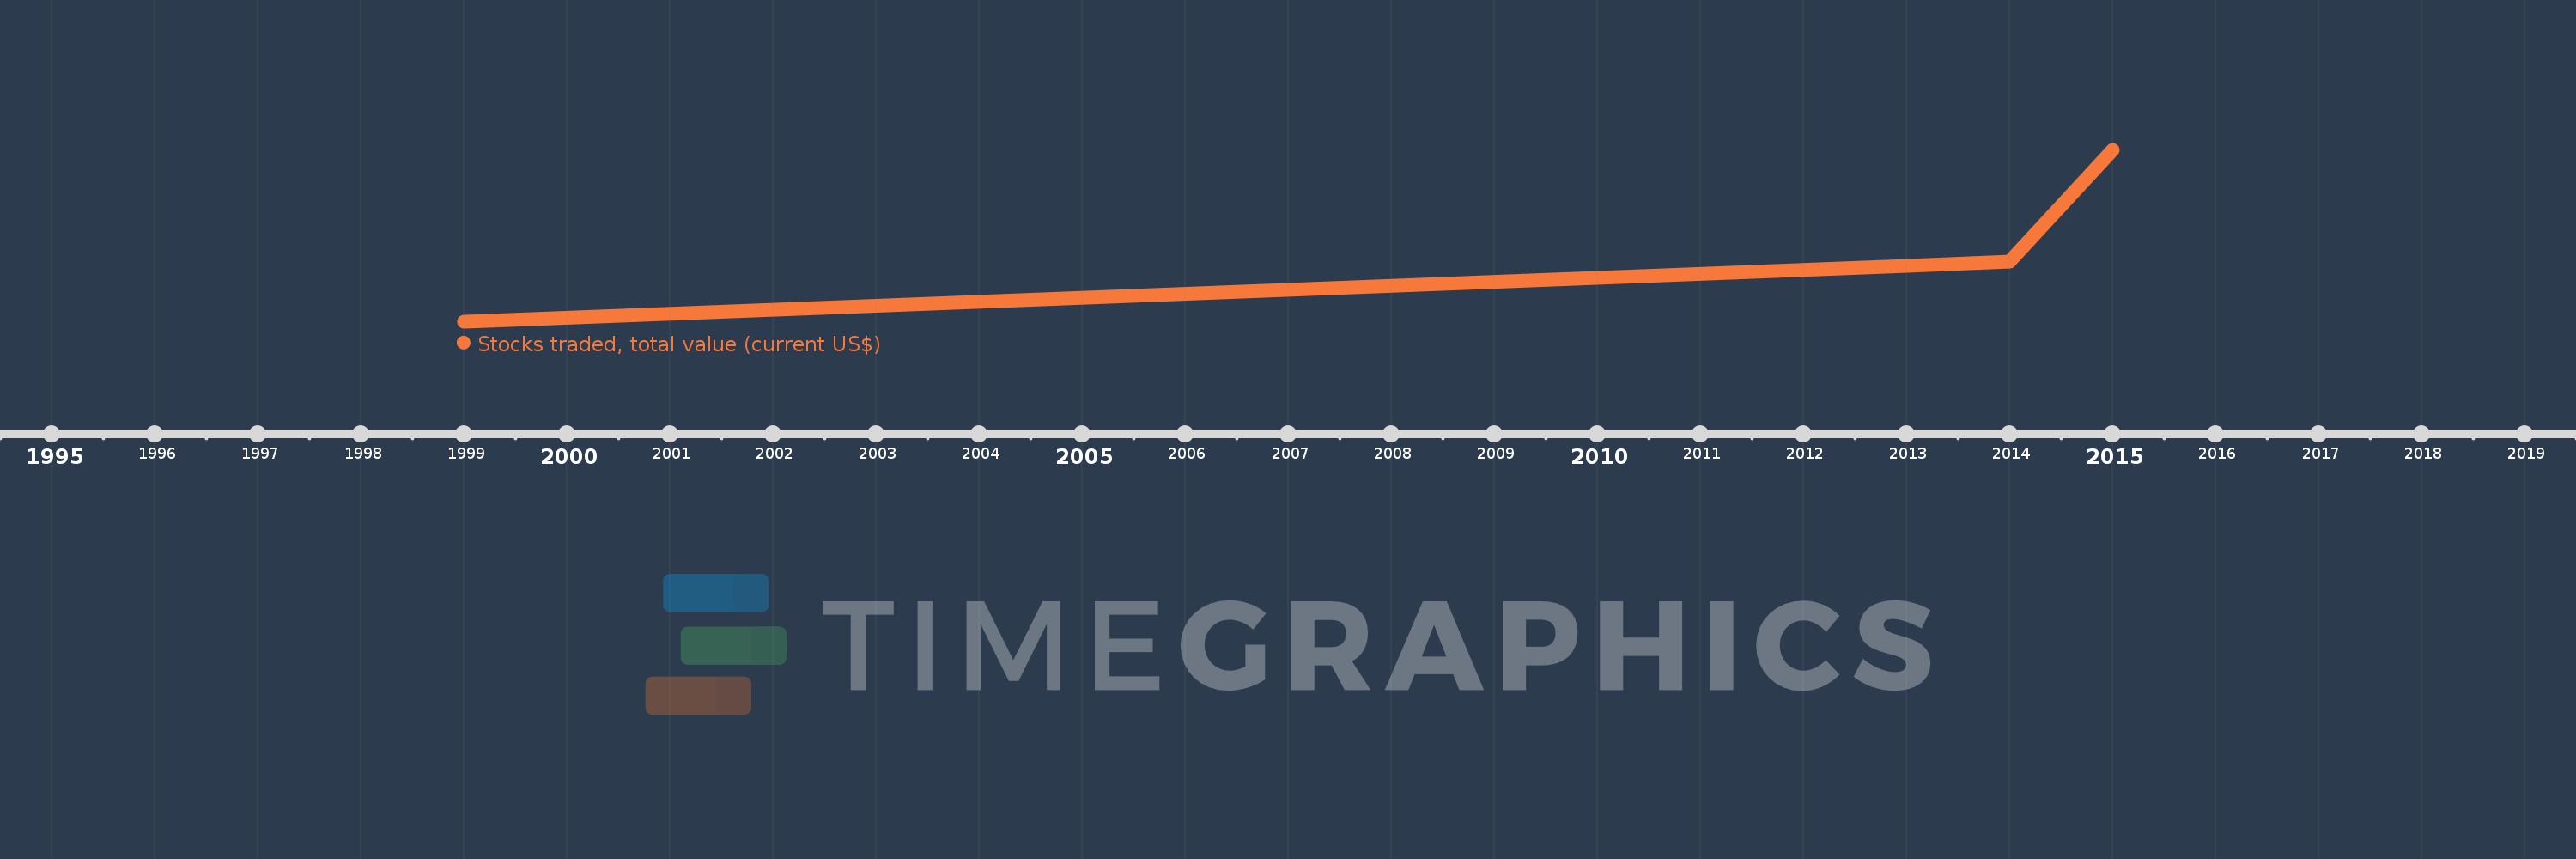
This timeline shows a graph from 1999 to 2015 of Other small states. No data until 1998. Number of actual observations by date: 4.
Source name:
World Development Indicators
Source organization:
World Federation of Exchanges database.
Categories, topics:
Financial Sector
Last updated:
apr 23, 2017
Indicators value changes by year
Minimum:
2.896 bln
jan 1, 1999
Maximum:
56.257 bln
jan 1, 2015
At the date of observation
Value
Absolute change
Change from the previous value
jan 1, 1999
2.896 bln
+2.896 bln
0.0%
jan 1, 2013
20.426 bln
+17.531 bln
605.42%
jan 1, 2014
21.633 bln
+1.206 bln
5.91%
jan 1, 2015
56.257 bln
+34.624 bln
160.05%
Ranking of countries by current statistics by years