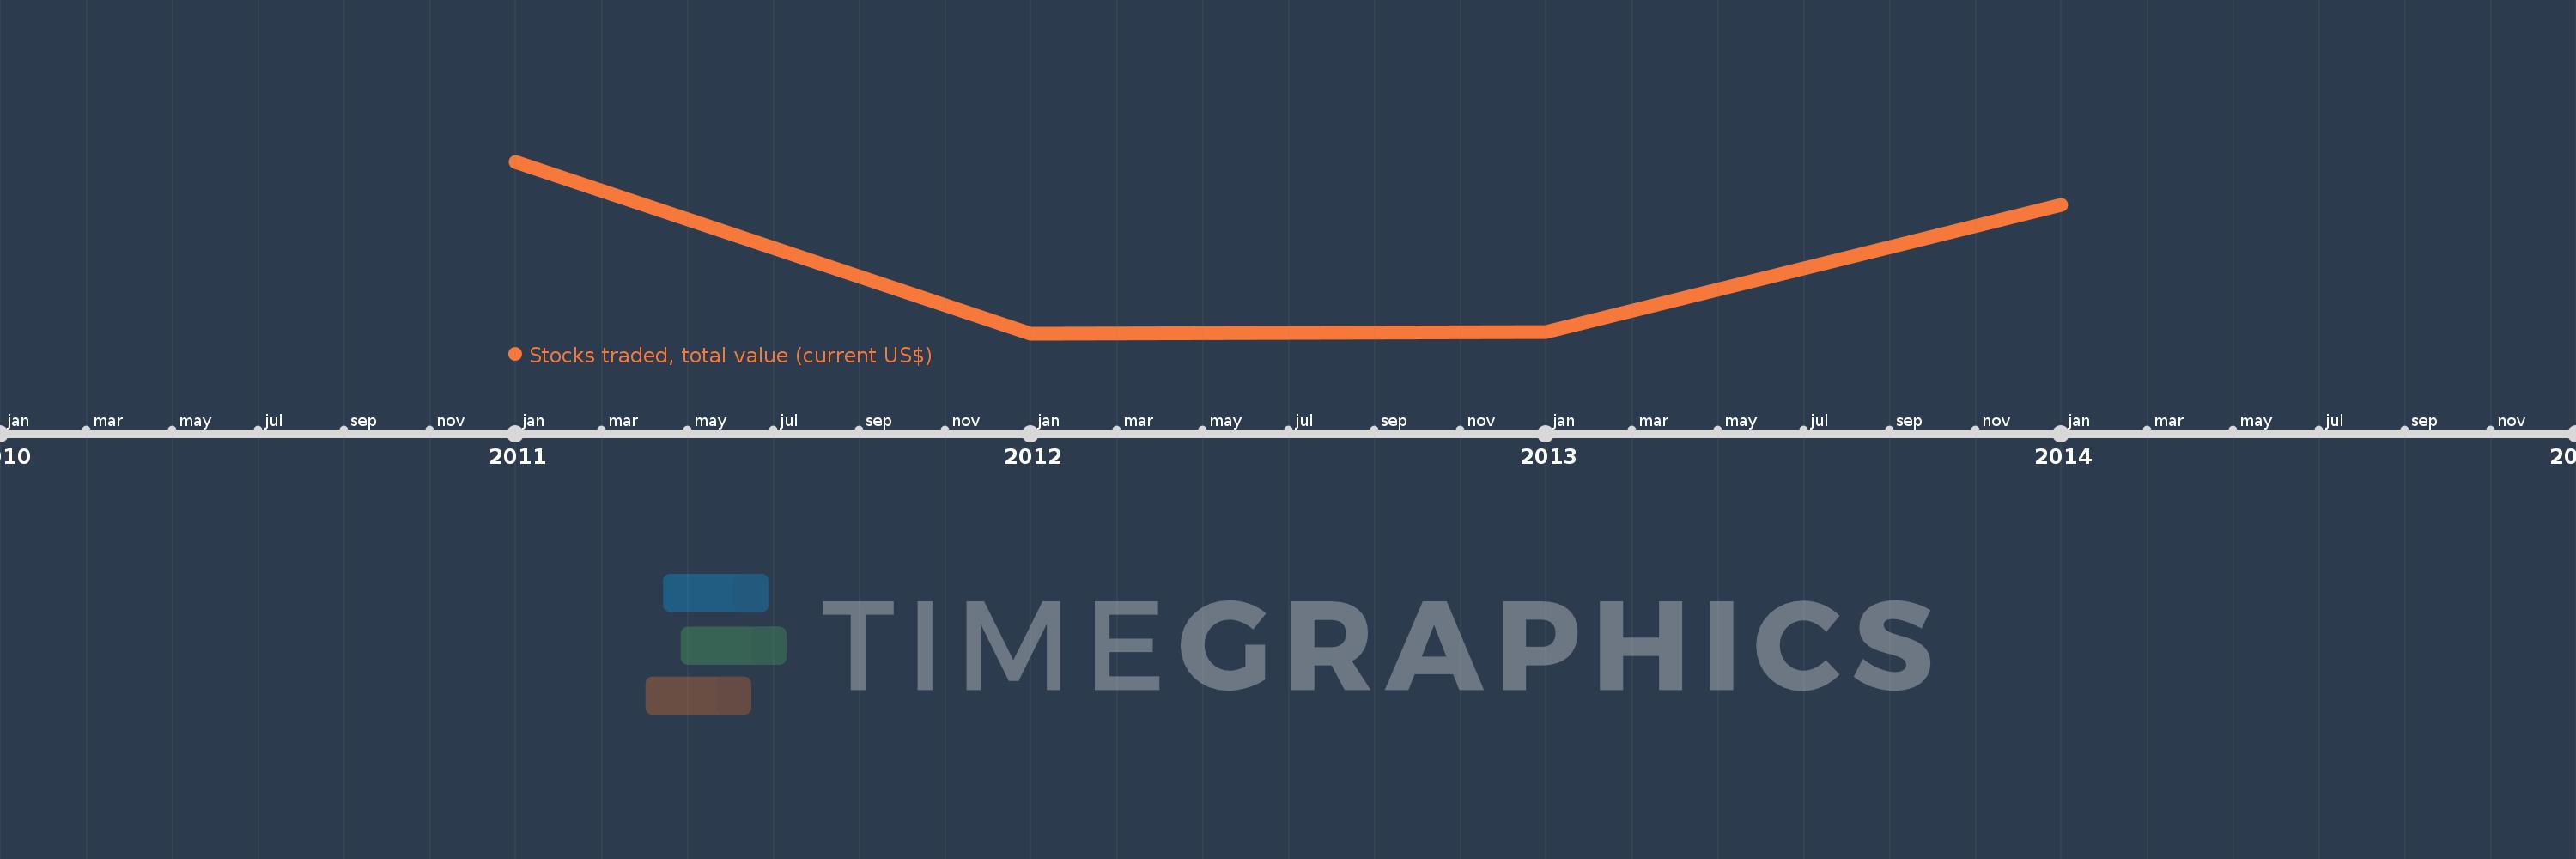
This timeline shows a graph from 2011 to 2014 of Middle East & North Africa (IDA & IBRD countries). No data until 2010. Number of actual observations by date: 4.
Source name:
World Development Indicators
Source organization:
World Federation of Exchanges database.
Categories, topics:
Financial Sector
Last updated:
apr 23, 2017
Indicators value changes by year
Meaning:
54.208 bln
Minimum:
39.859 bln
jan 1, 2012
Maximum:
72.611 bln
jan 1, 2011
At the date of observation
Value
Absolute change
Change from the previous value
jan 1, 2011
72.611 bln
+72.611 bln
0.0%
jan 1, 2012
39.859 bln
-32.752 bln
-45.11%
jan 1, 2013
40.037 bln
+177.92 mln
0.45%
jan 1, 2014
64.324 bln
+24.287 bln
60.66%
Ranking of countries by current statistics by years