Download This statistics in other country:
Timeline:
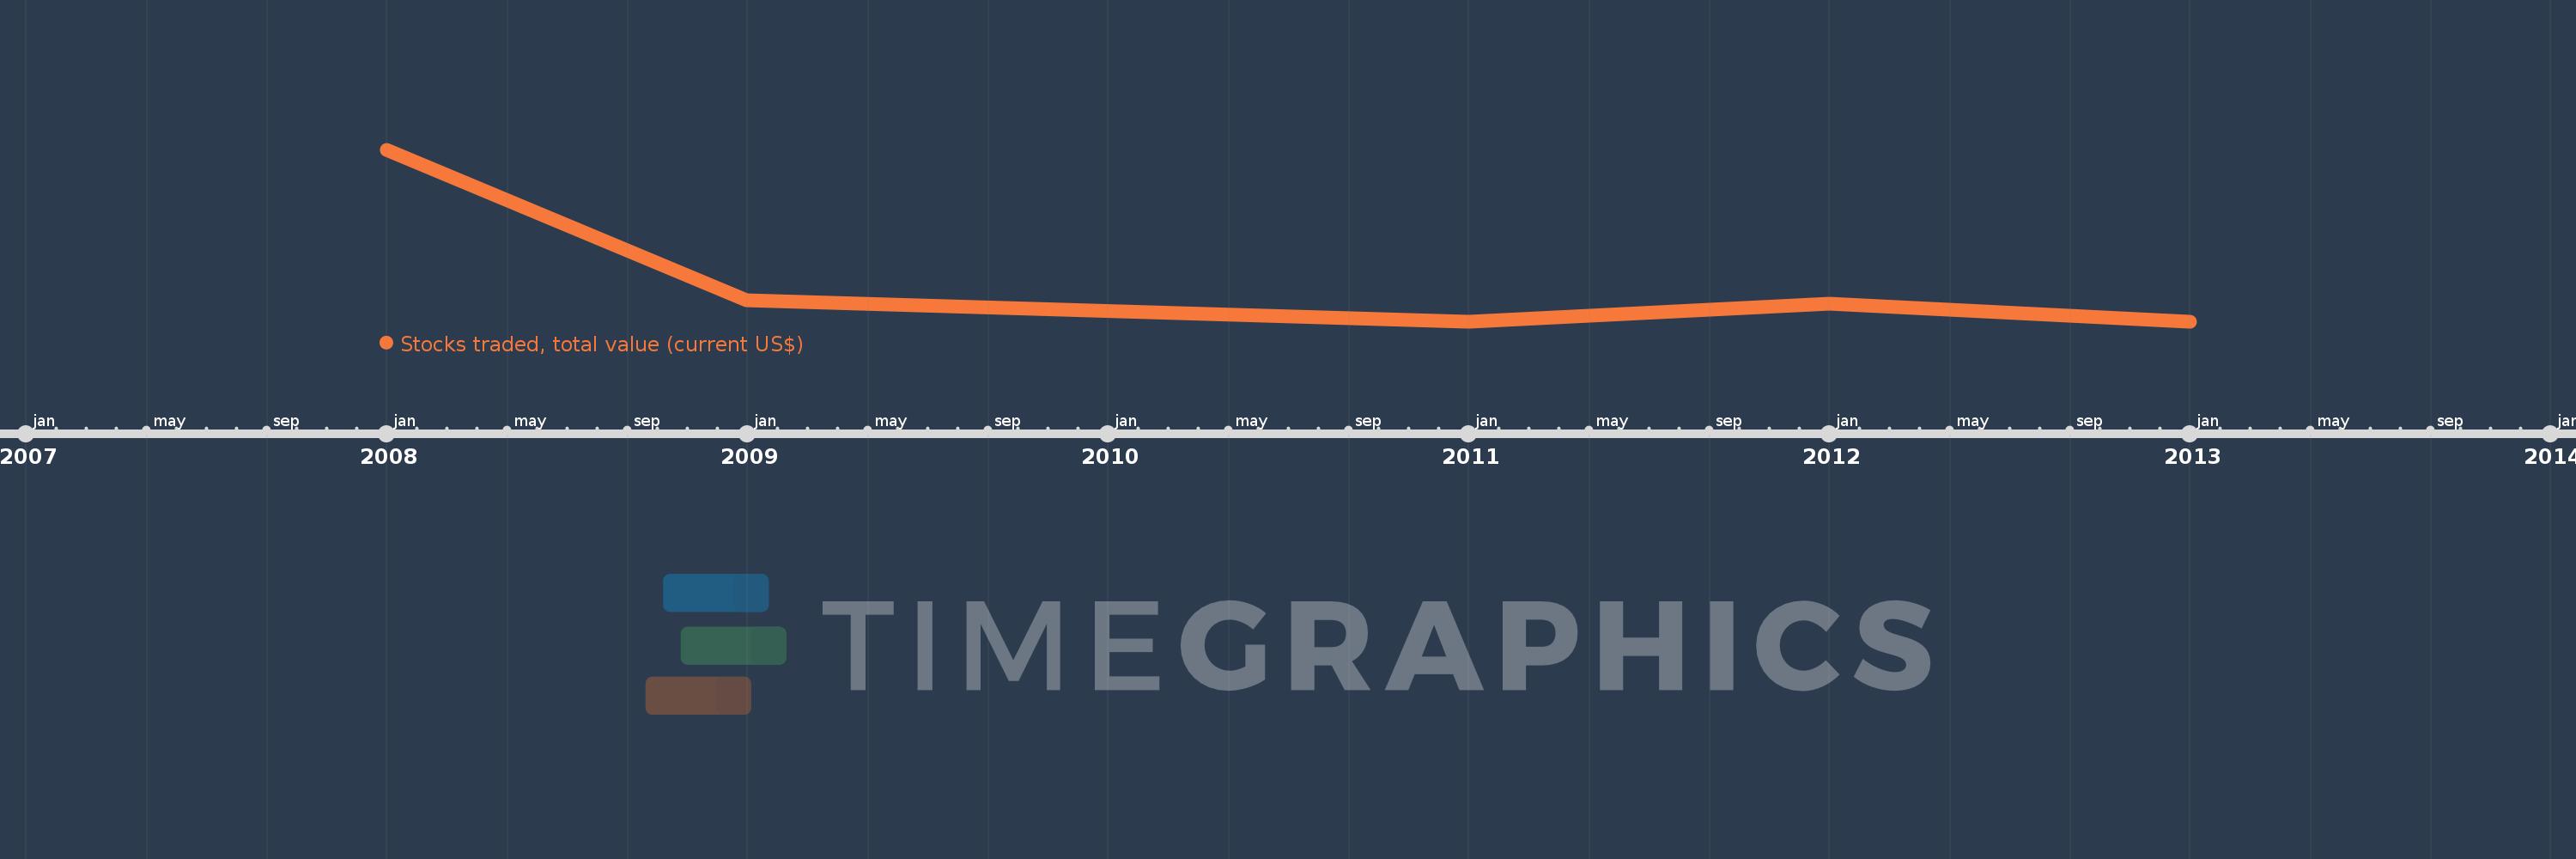
This timeline shows a graph from 2008 to 2013 of Montenegro. No data until 2007. Number of actual observations by date: 5.
Source name:
World Development Indicators
Source organization:
World Federation of Exchanges database.
Categories, topics:
Financial Sector
Last updated:
apr 23, 2017
Indicators value changes by year
Minimum:
43.51 mln
jan 1, 2013
Maximum:
357.02 mln
jan 1, 2008
At the date of observation
Value
Absolute change
Change from the previous value
jan 1, 2008
357.02 mln
+357.02 mln
0.0%
jan 1, 2009
83.27 mln
-273.75 mln
-76.68%
jan 1, 2011
44.4 mln
-38.87 mln
-46.68%
jan 1, 2012
76.59 mln
+32.19 mln
72.5%
jan 1, 2013
43.51 mln
-33.08 mln
-43.19%
Ranking of countries by current statistics by years