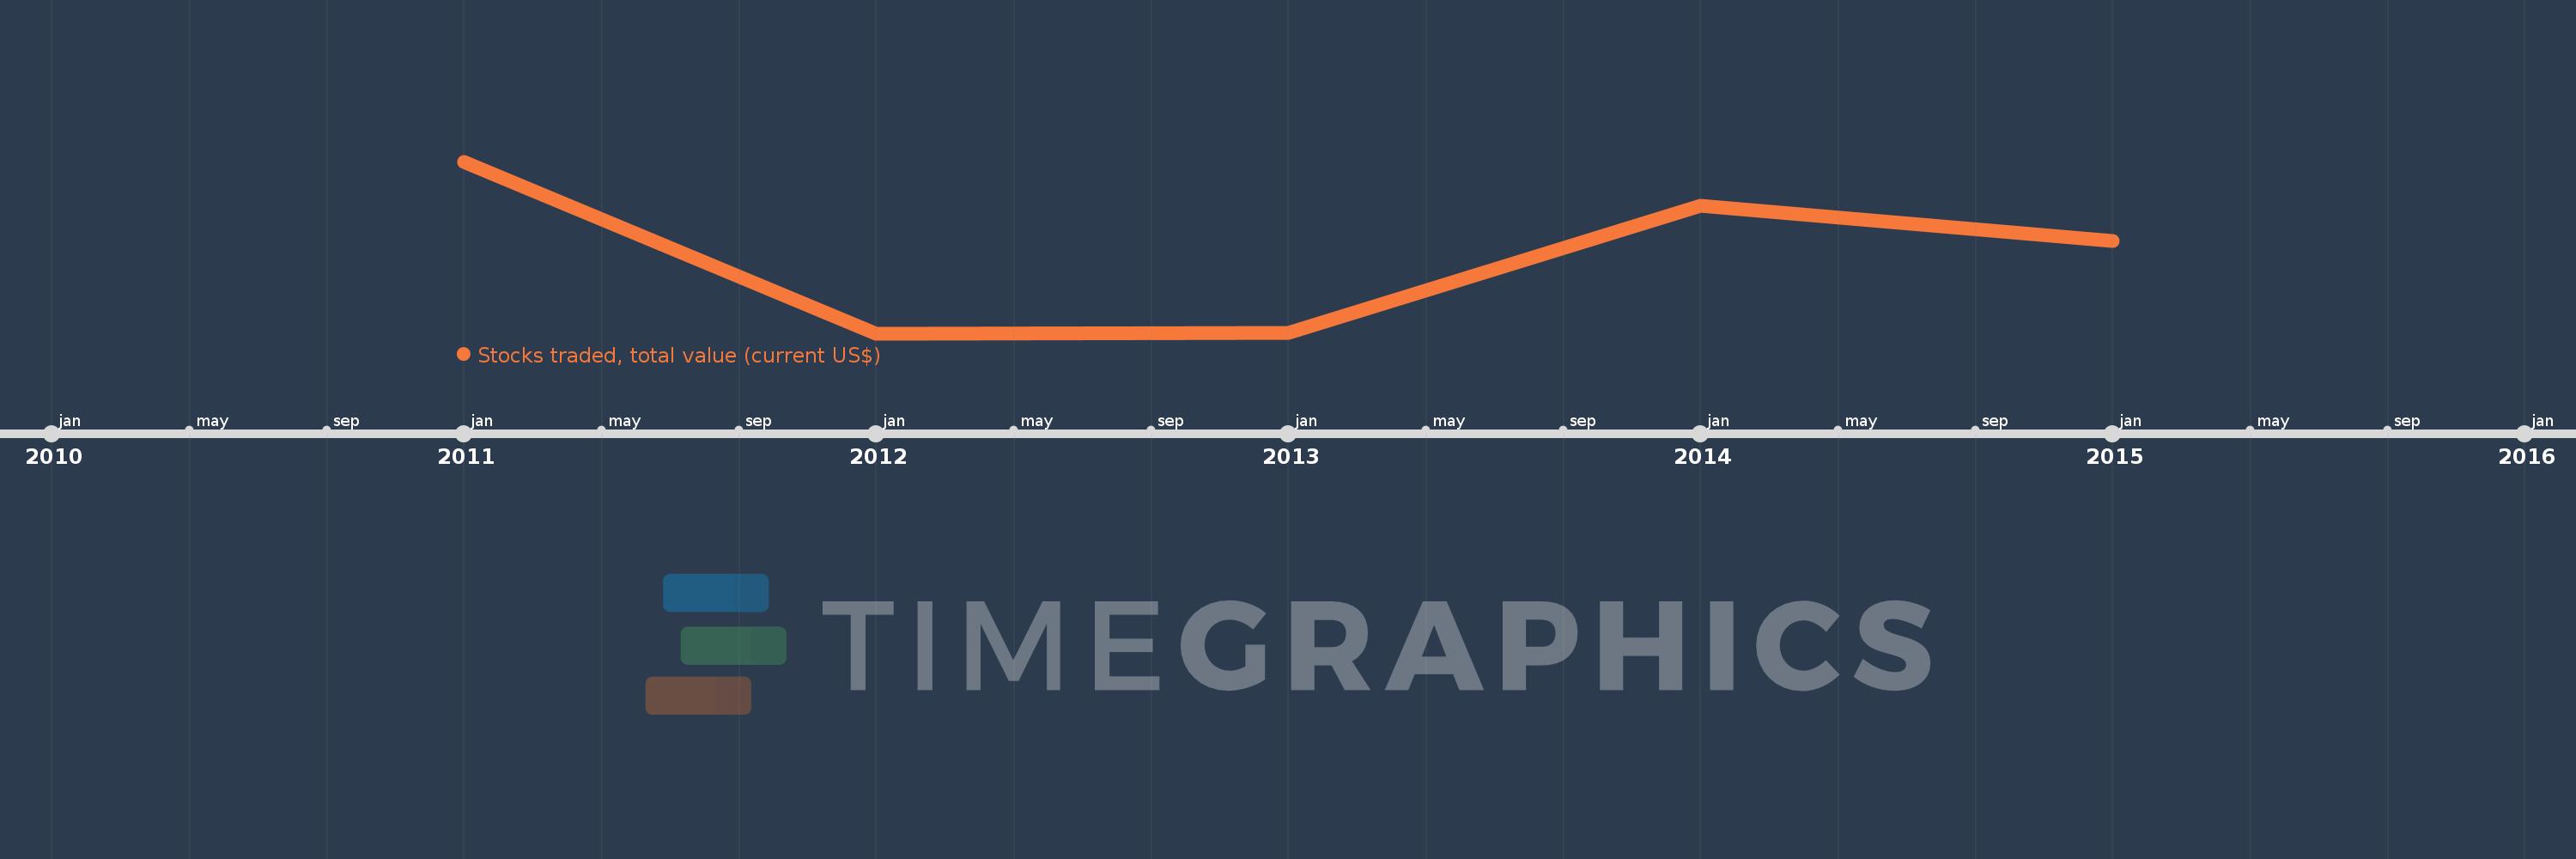
This timeline shows a graph from 2011 to 2015 of Middle East & North Africa (excluding high income). No data until 2010. Number of actual observations by date: 5.
Source name:
World Development Indicators
Source organization:
World Federation of Exchanges database.
Categories, topics:
Financial Sector
Last updated:
apr 23, 2017
Indicators value changes by year
Meaning:
55.159 bln
Minimum:
40.161 bln
jan 1, 2012
Maximum:
72.985 bln
jan 1, 2011
At the date of observation
Value
Absolute change
Change from the previous value
jan 1, 2011
72.985 bln
+72.985 bln
0.0%
jan 1, 2012
40.161 bln
-32.824 bln
-44.97%
jan 1, 2013
40.28 bln
+118.37 mln
0.29%
jan 1, 2014
64.564 bln
+24.285 bln
60.29%
jan 1, 2015
57.805 bln
-6.76 bln
-10.47%
Ranking of countries by current statistics by years