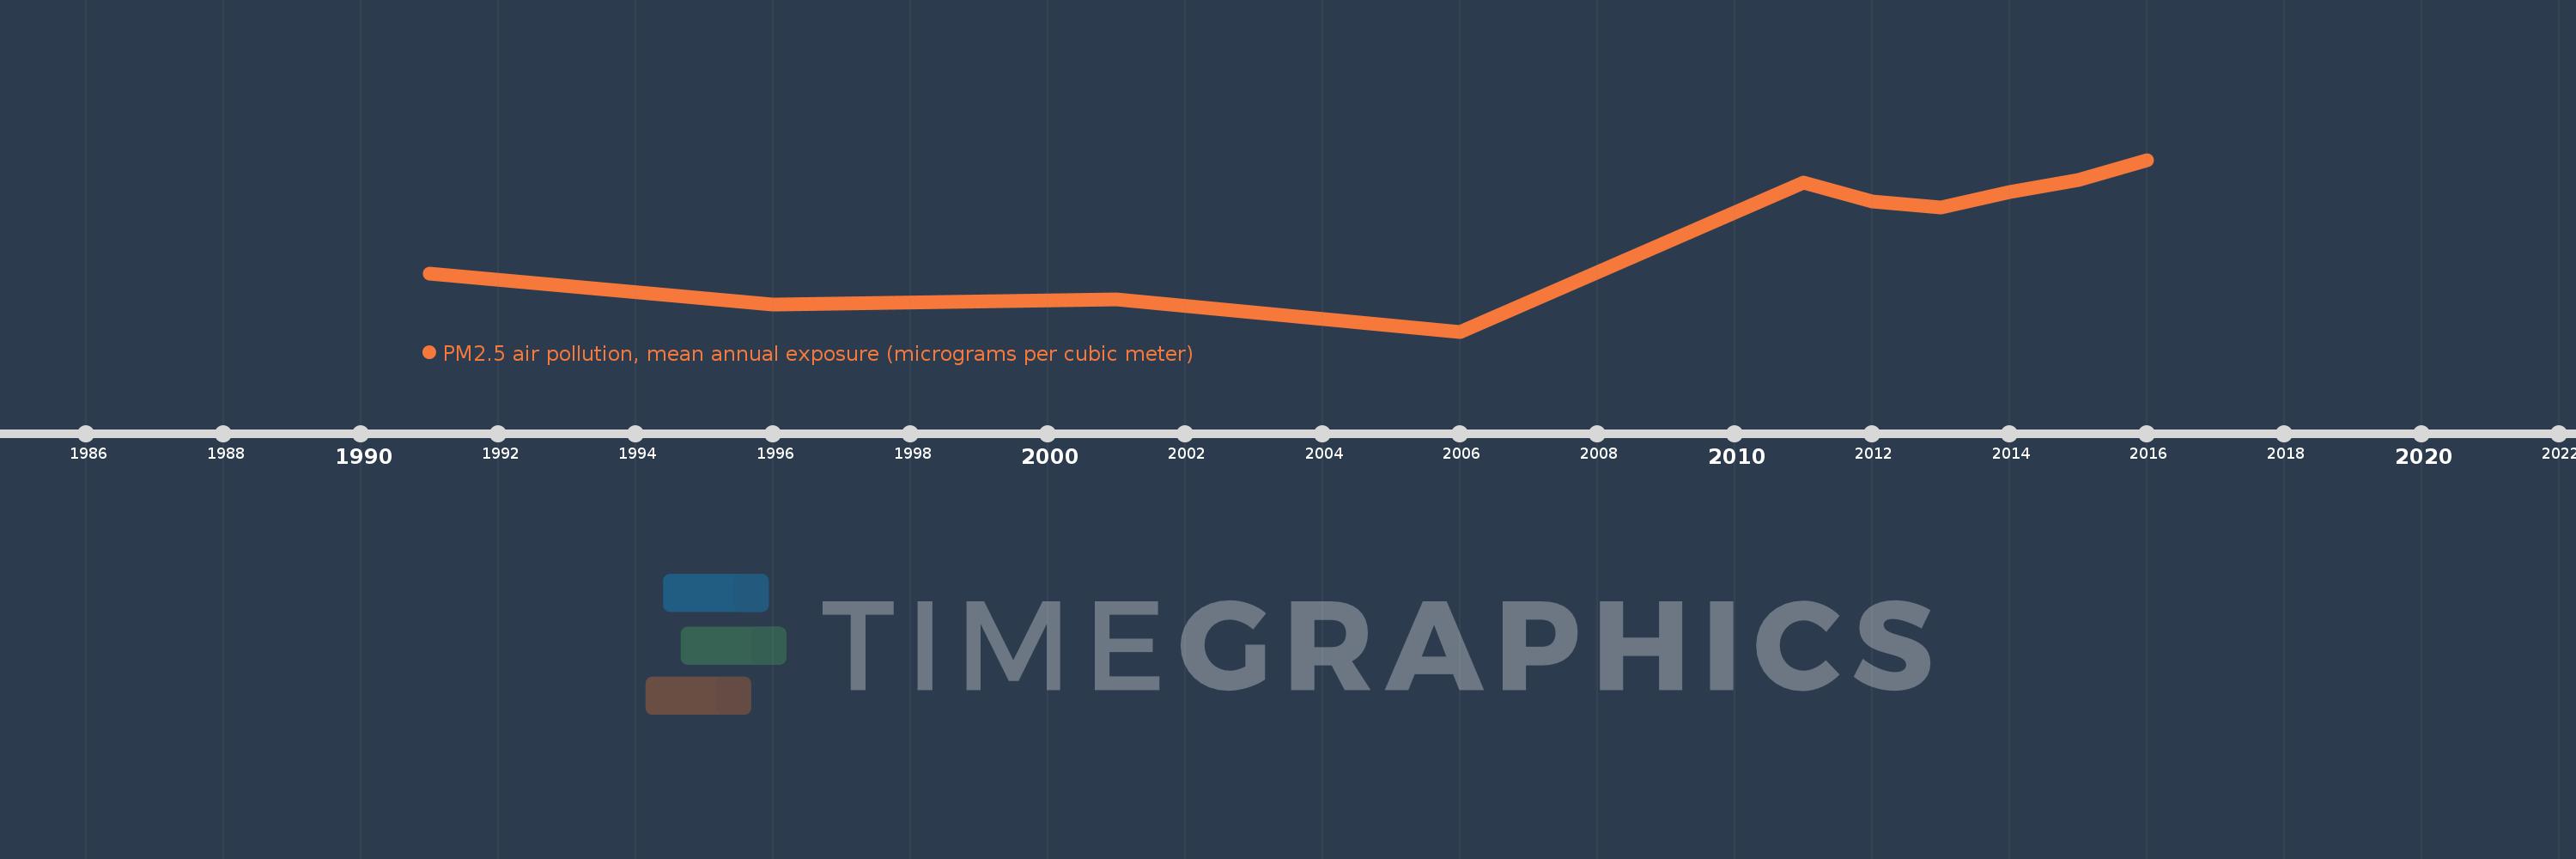
This timeline shows a graph from 1991 to 2016 of Middle East & North Africa (IDA & IBRD countries). No data until 1990. Number of actual observations by date: 10.
Source name:
World Development Indicators
Source organization:
Brauer, M. et al. 2016, for the Global Burden of Disease Study 2015.
Categories, topics:
Urban Development, Environment
Last updated:
apr 23, 2017
Indicators value changes by year
Meaning:
49.241
Minimum:
43.216
jan 1, 2006
Maximum:
53.748
jan 1, 2016
At the date of observation
Value
Absolute change
Change from the previous value
jan 1, 1991
46.767
+46.767
0.0%
jan 1, 1996
44.879
-1.888
-4.04%
jan 1, 2001
45.168
+0.289
0.64%
jan 1, 2006
43.216
-1.952
-4.32%
jan 1, 2011
52.365
+9.149
21.17%
jan 1, 2012
51.198
-1.168
-2.23%
jan 1, 2013
50.803
-0.395
-0.77%
jan 1, 2014
51.759
+0.956
1.88%
jan 1, 2015
52.509
+0.75
1.45%
jan 1, 2016
53.748
+1.239
2.36%
Ranking of countries by current statistics by years