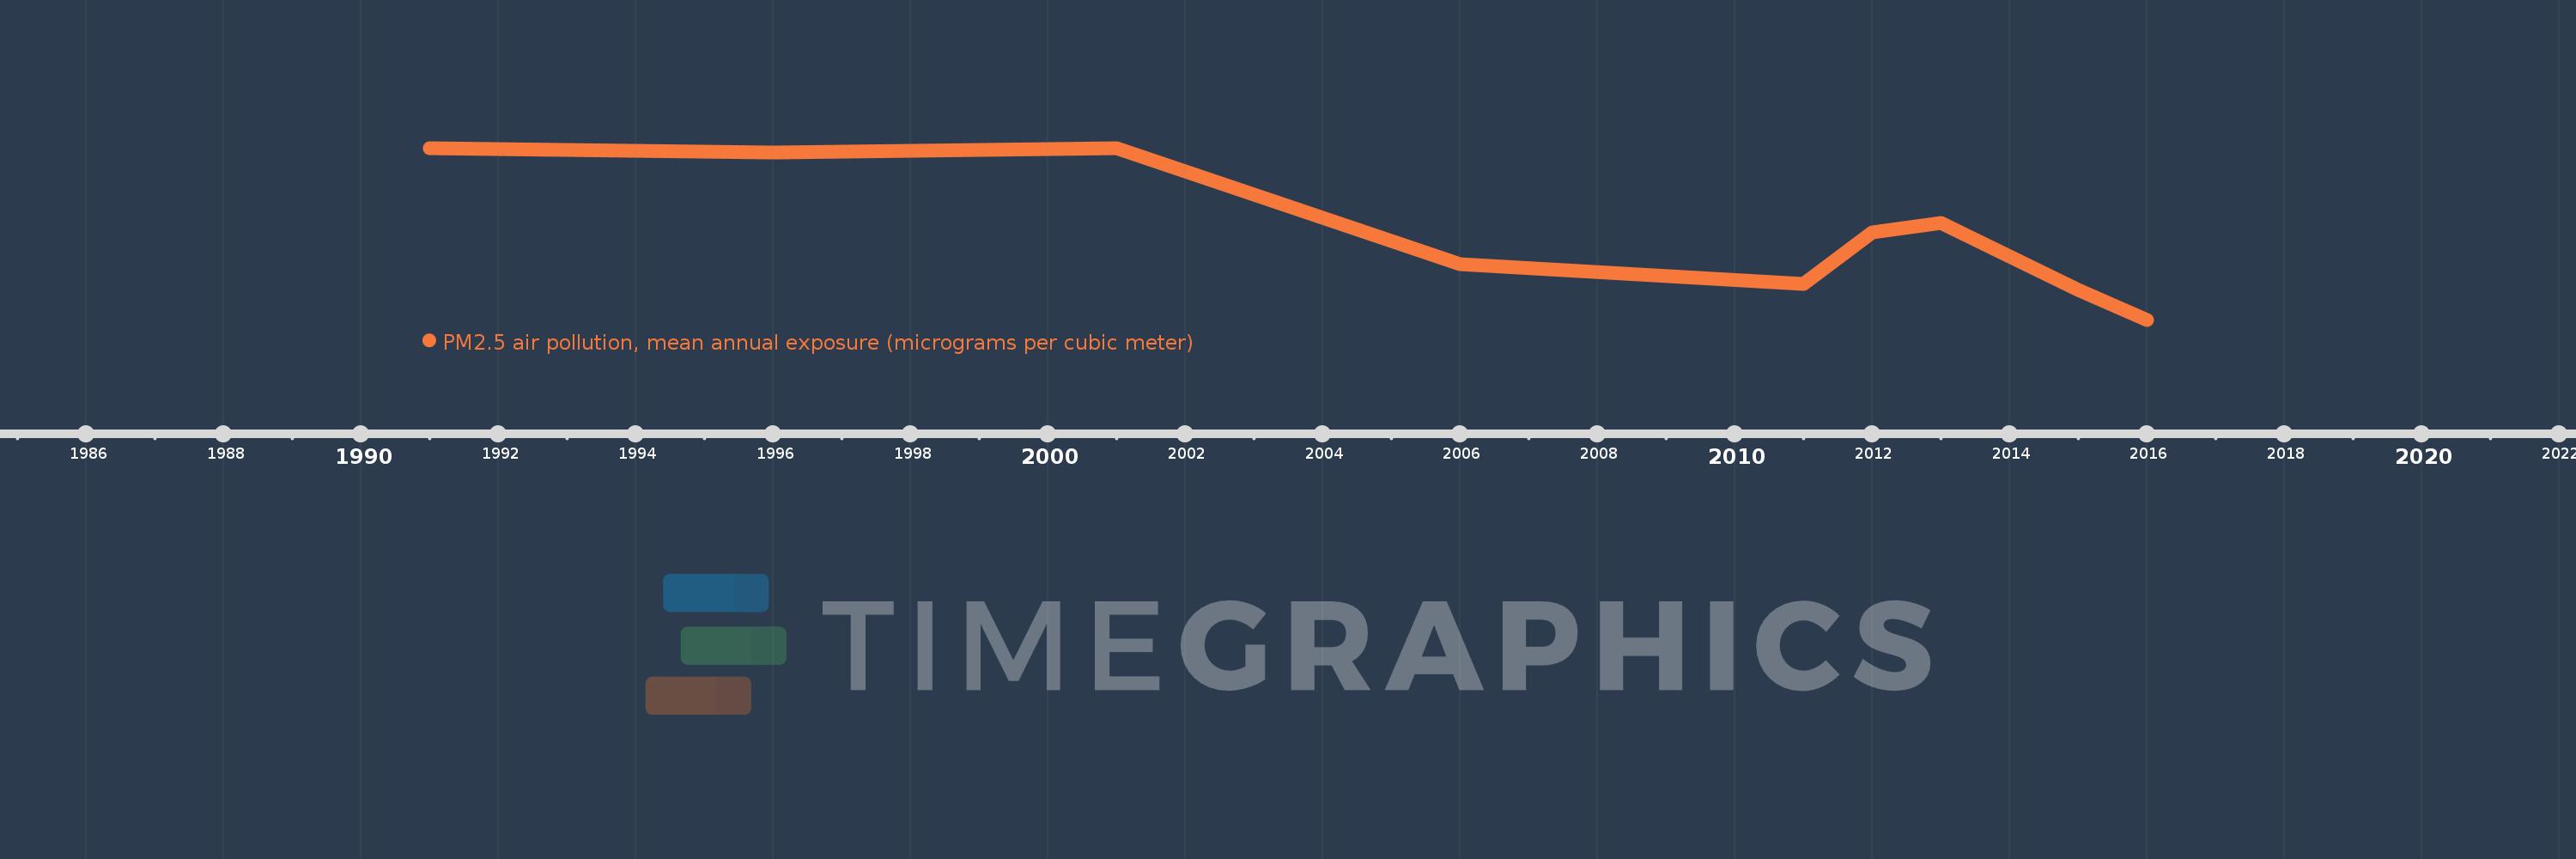
This timeline shows a graph from 1991 to 2016 of Heavily indebted poor countries (HIPC). No data until 1990. Number of actual observations by date: 10.
Source name:
World Development Indicators
Source organization:
Brauer, M. et al. 2016, for the Global Burden of Disease Study 2015.
Categories, topics:
Urban Development, Environment
Last updated:
apr 23, 2017
Indicators value changes by year
Meaning:
36.715
Minimum:
33.484
jan 1, 2016
Maximum:
39.791
jan 1, 2001
At the date of observation
Value
Absolute change
Change from the previous value
jan 1, 1991
39.771
+39.771
0.0%
jan 1, 1996
39.635
-0.136
-0.34%
jan 1, 2001
39.791
+0.156
0.39%
jan 1, 2006
35.54
-4.251
-10.68%
jan 1, 2011
34.806
-0.734
-2.06%
jan 1, 2012
36.695
+1.889
5.43%
jan 1, 2013
37.046
+0.351
0.96%
jan 1, 2014
35.804
-1.242
-3.35%
jan 1, 2015
34.575
-1.229
-3.43%
jan 1, 2016
33.484
-1.091
-3.16%
Ranking of countries by current statistics by years