This timeline shows a graph from 1991 to 2016 of Fragile and conflict affected situations. No data until 1990. Number of actual observations by date: 10.
Source name:
World Development Indicators
Source organization:
Brauer, M. et al. 2016, for the Global Burden of Disease Study 2015.
Categories, topics:
Urban Development, Environment
Last updated:
apr 23, 2017
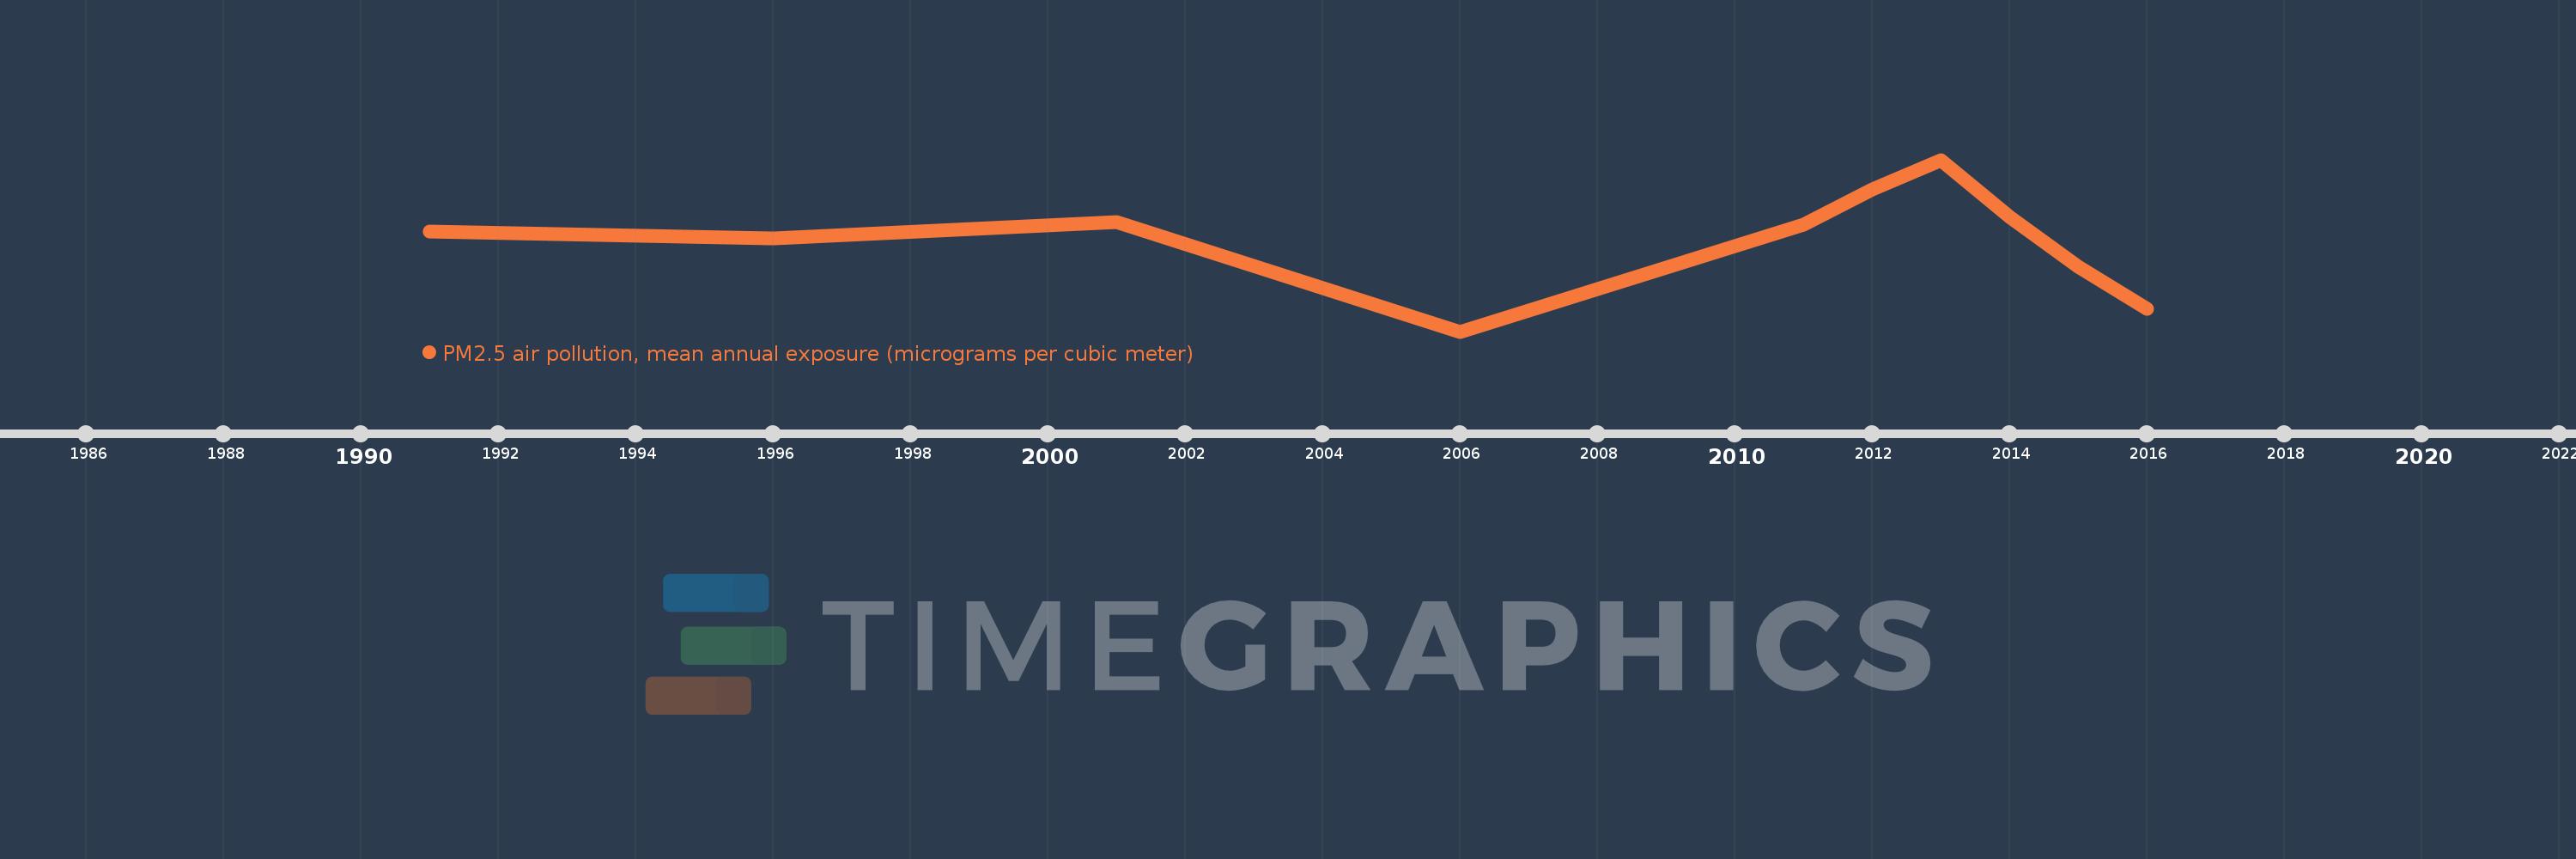
Indicators value changes by year
Meaning:
38.065
Minimum:
36.143
jan 1, 2006
Maximum:
39.712
jan 1, 2013
At the date of observation
Value
Absolute change
Change from the previous value
jan 1, 1991
38.224
+38.224
0.0%
jan 1, 1996
38.072
-0.152
-0.4%
jan 1, 2001
38.418
+0.345
0.91%
jan 1, 2006
36.143
-2.275
-5.92%
jan 1, 2011
38.362
+2.219
6.14%
jan 1, 2012
39.089
+0.728
1.9%
jan 1, 2013
39.712
+0.623
1.59%
jan 1, 2014
38.521
-1.192
-3.0%
jan 1, 2015
37.495
-1.026
-2.66%
jan 1, 2016
36.615
-0.88
-2.35%
Ranking of countries by current statistics by years