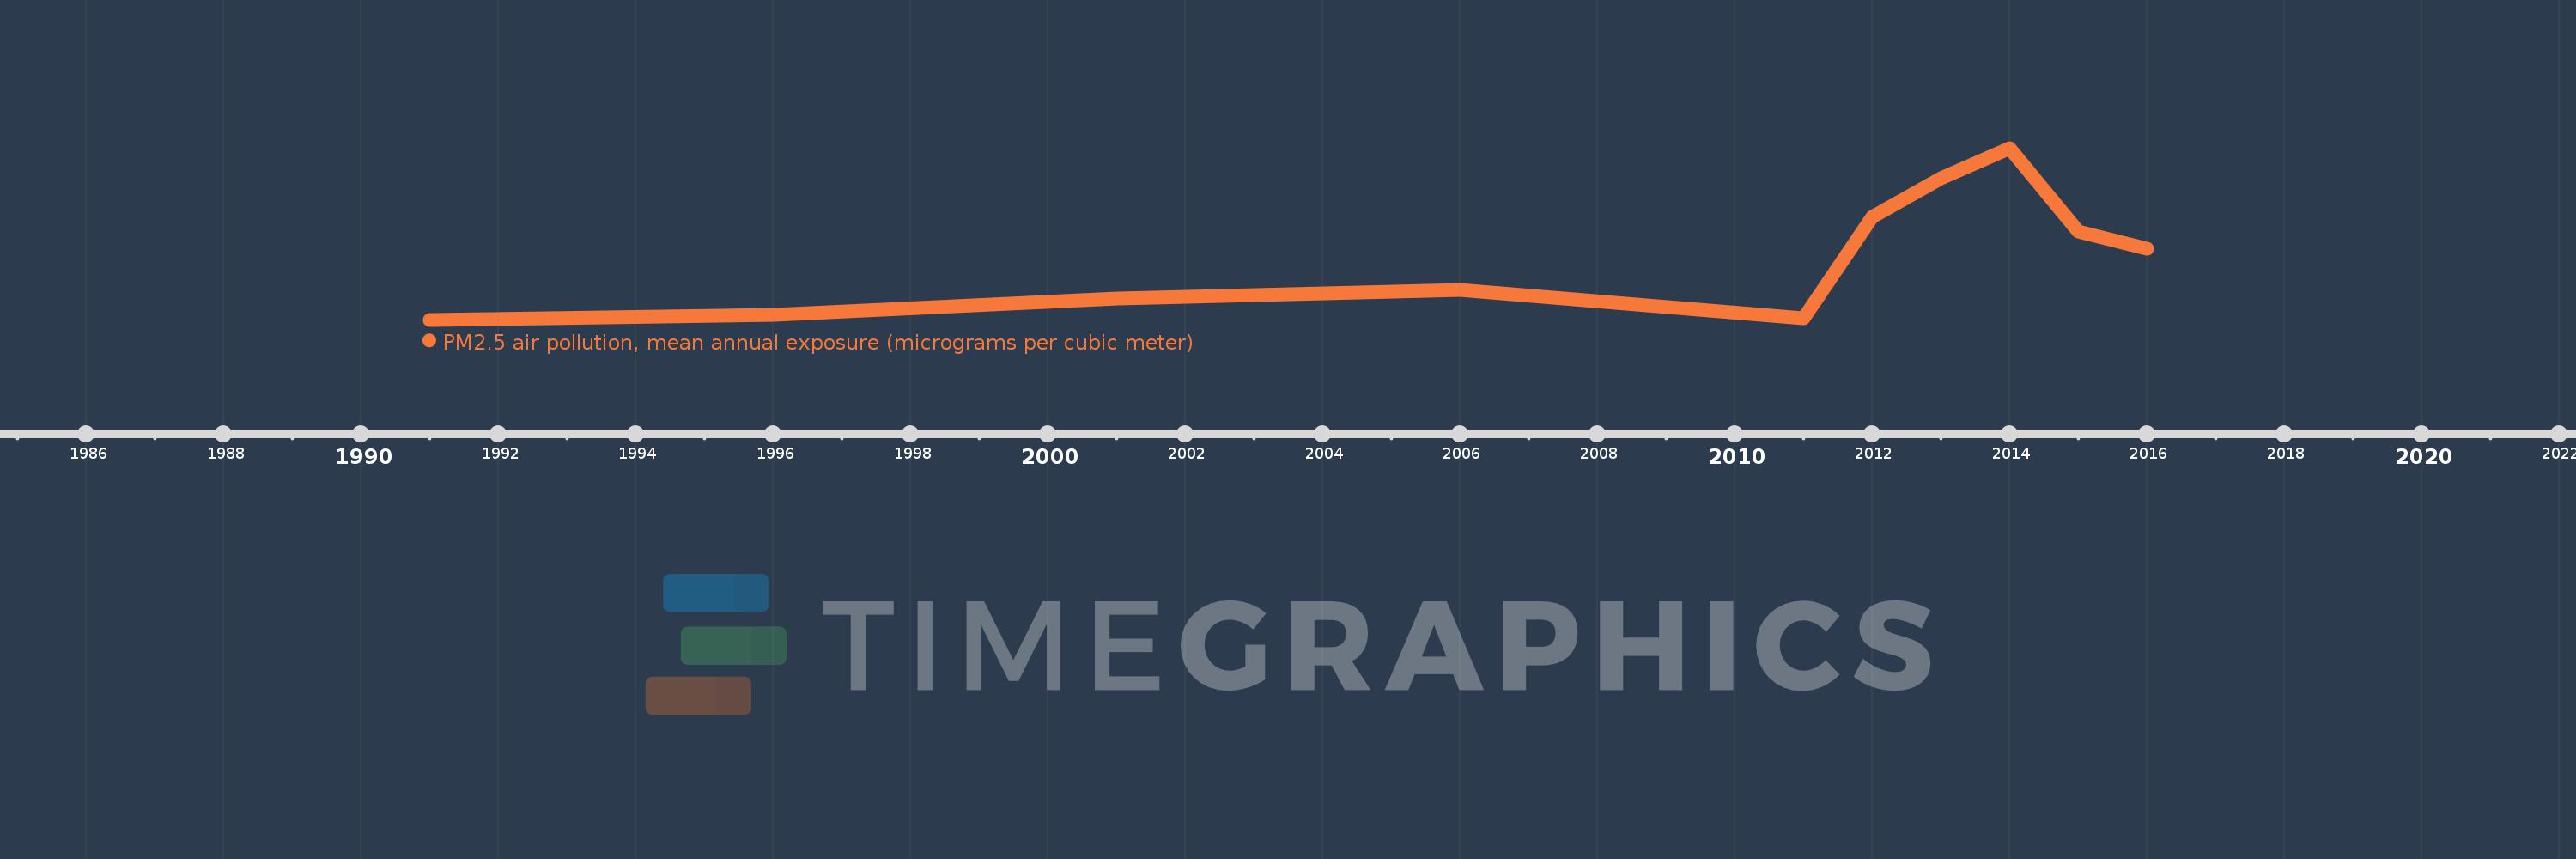
This timeline shows a graph from 1991 to 2016 of Least developed countries: UN classification. No data until 1990. Number of actual observations by date: 10.
Source name:
World Development Indicators
Source organization:
Brauer, M. et al. 2016, for the Global Burden of Disease Study 2015.
Categories, topics:
Urban Development, Environment
Last updated:
apr 23, 2017
Indicators value changes by year
Meaning:
44.401
Minimum:
43.618
jan 1, 1991
Maximum:
45.745
jan 1, 2014
At the date of observation
Value
Absolute change
Change from the previous value
jan 1, 1991
43.618
+43.618
0.0%
jan 1, 1996
43.678
+0.06
0.14%
jan 1, 2001
43.877
+0.199
0.46%
jan 1, 2006
43.982
+0.105
0.24%
jan 1, 2011
43.636
-0.346
-0.79%
jan 1, 2012
44.891
+1.256
2.88%
jan 1, 2013
45.371
+0.48
1.07%
jan 1, 2014
45.745
+0.374
0.82%
jan 1, 2015
44.715
-1.03
-2.25%
jan 1, 2016
44.501
-0.215
-0.48%
Ranking of countries by current statistics by years