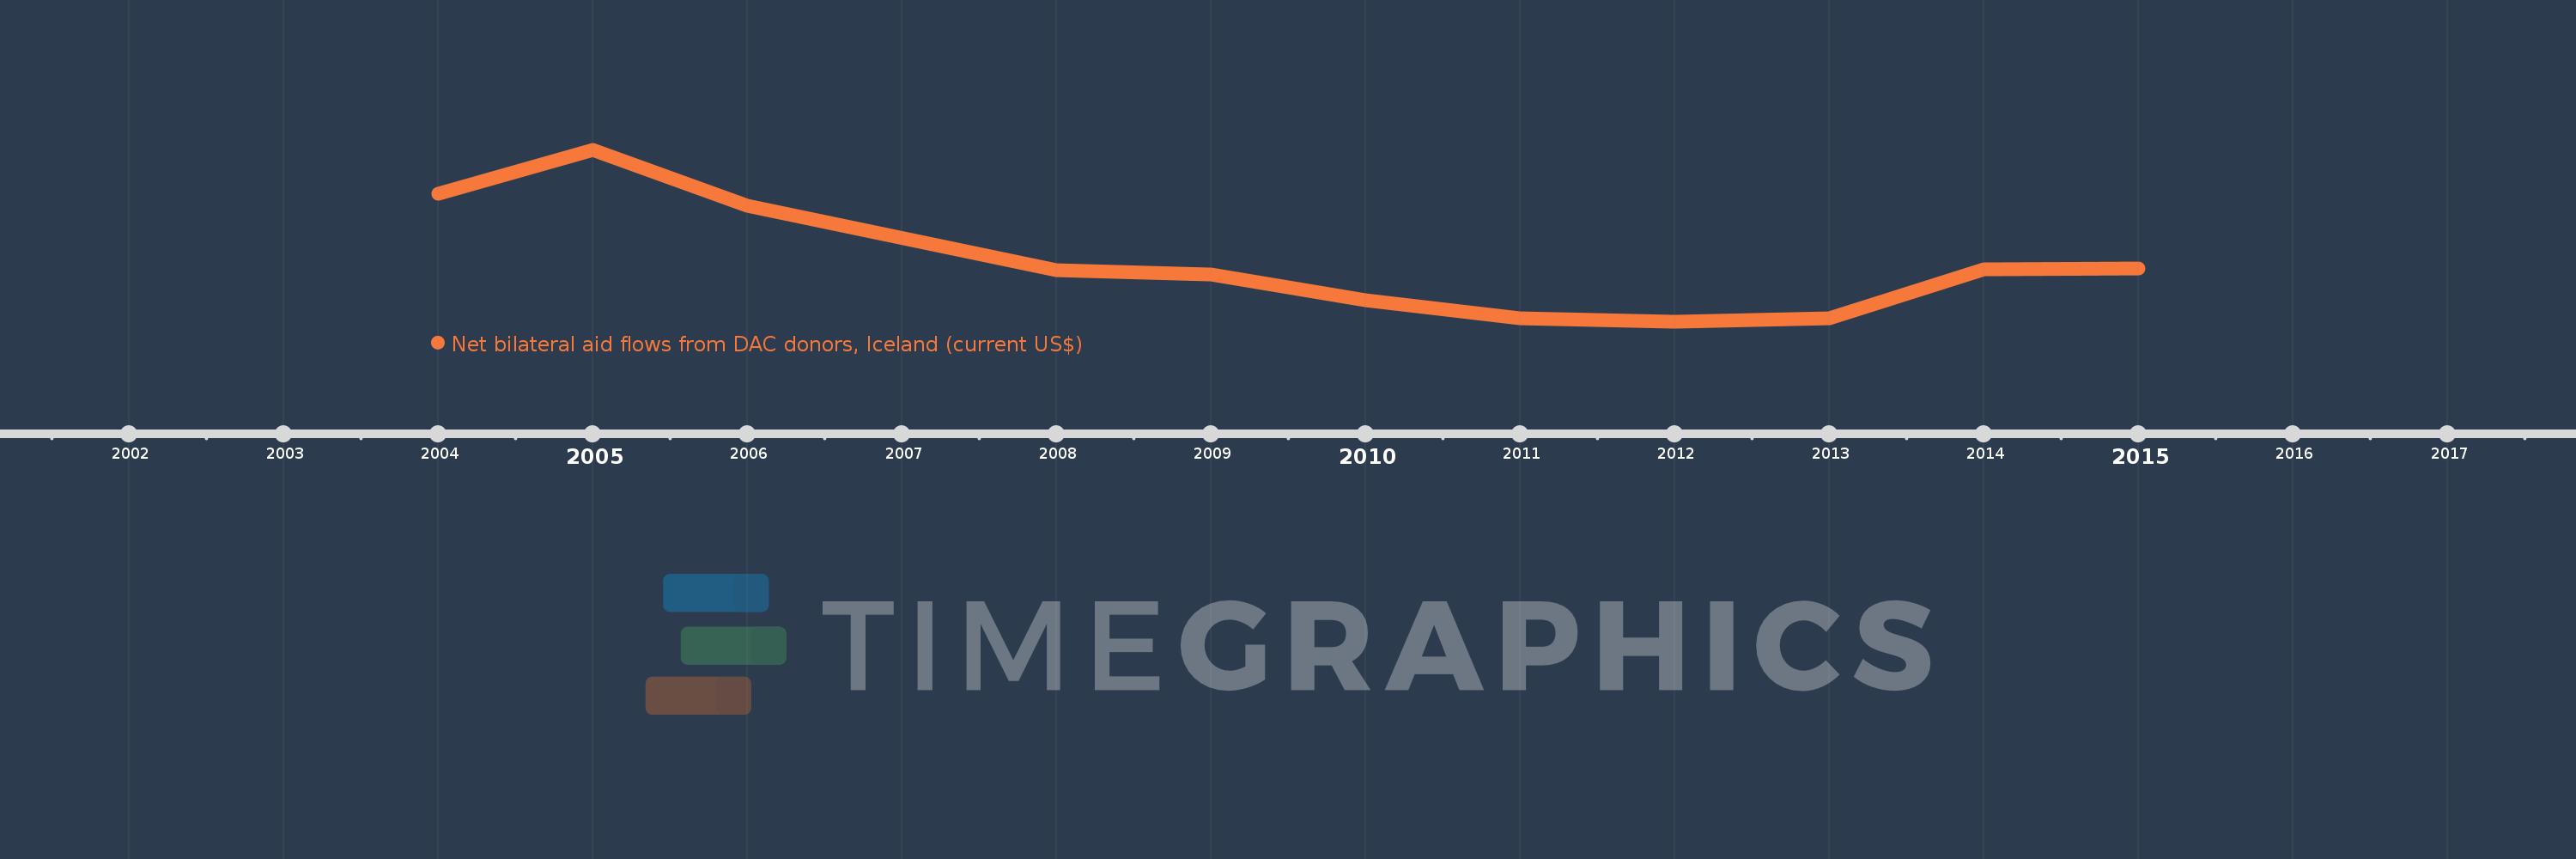
This timeline shows a graph from 2004 to 2015 of Middle East & North Africa (IDA & IBRD countries). No data until 2003. Number of actual observations by date: 11.
Source name:
World Development Indicators
Source organization:
Development Assistance Committee of the Organisation for Economic Co-operation and Development, Geographical Distribution of Financial Flows to Developing Countries, Development Co-operation Report, and International Development Statistics database. Data are available online at: www.oecd.org/dac/stats/idsonline.
Categories, topics:
Aid Effectiveness
Last updated:
apr 23, 2017
Indicators value changes by year
Meaning:
641.818K
Minimum:
170.0K
jan 1, 2012
Maximum:
1.54 mln
jan 1, 2005
At the date of observation
Value
Absolute change
Change from the previous value
jan 1, 2004
1.19 mln
+1.19 mln
0.0%
jan 1, 2005
1.54 mln
+350.0K
29.41%
jan 1, 2006
1.1 mln
-440.0K
-28.57%
jan 1, 2008
580.0K
-520.0K
-47.27%
jan 1, 2009
550.0K
-30.0K
-5.17%
jan 1, 2010
340.0K
-210.0K
-38.18%
jan 1, 2011
200.0K
-140.0K
-41.18%
jan 1, 2012
170.0K
-30.0K
-15.0%
jan 1, 2013
200.0K
+30.0K
17.65%
jan 1, 2014
590.0K
+390.0K
195.0%
jan 1, 2015
600.0K
+10.0K
1.69%
Ranking of countries by current statistics by years