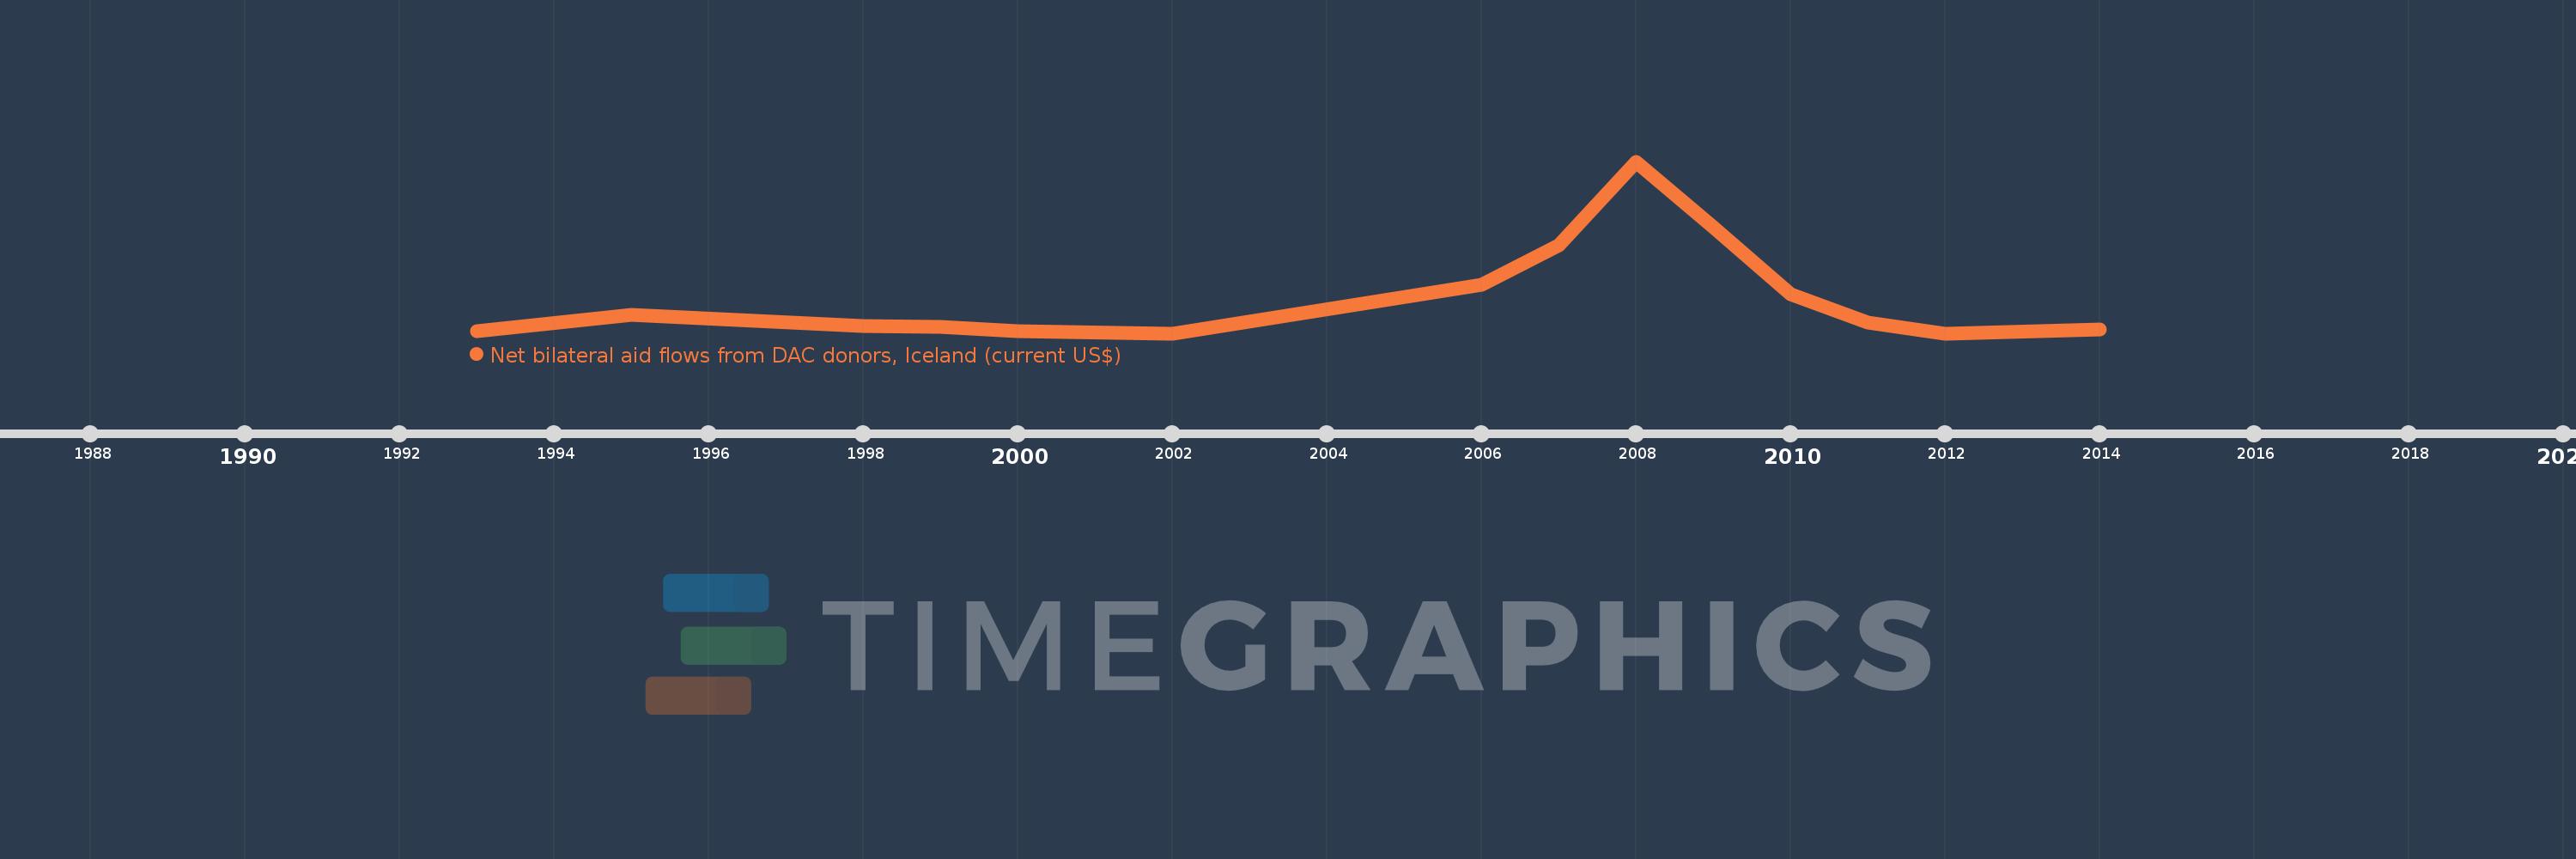
This timeline shows a graph from 1993 to 2014 of IDA blend. No data until 1992. Number of actual observations by date: 14.
Source name:
World Development Indicators
Source organization:
Development Assistance Committee of the Organisation for Economic Co-operation and Development, Geographical Distribution of Financial Flows to Developing Countries, Development Co-operation Report, and International Development Statistics database. Data are available online at: www.oecd.org/dac/stats/idsonline.
Categories, topics:
Aid Effectiveness
Last updated:
apr 23, 2017
Indicators value changes by year
Meaning:
850.714K
Minimum:
60.0K
jan 1, 2002
Maximum:
3.82 mln
jan 1, 2008
At the date of observation
Value
Absolute change
Change from the previous value
jan 1, 1993
100.0K
+100.0K
0.0%
jan 1, 1995
470.0K
+370.0K
370.0%
jan 1, 1998
220.0K
-250.0K
-53.19%
jan 1, 1999
210.0K
-10.0K
-4.55%
jan 1, 2000
110.0K
-100.0K
-47.62%
jan 1, 2002
60.0K
-50.0K
-45.45%
jan 1, 2006
1.13 mln
+1.07 mln
1.78K%
jan 1, 2007
1.98 mln
+850.0K
75.22%
jan 1, 2008
3.82 mln
+1.84 mln
92.93%
jan 1, 2009
2.39 mln
-1.43 mln
-37.43%
jan 1, 2010
920.0K
-1.47 mln
-61.51%
jan 1, 2011
300.0K
-620.0K
-67.39%
jan 1, 2012
60.0K
-240.0K
-80.0%
jan 1, 2014
140.0K
+80.0K
133.33%
Ranking of countries by current statistics by years